World Happiness: What 14 Years of Data Actually Shows
Every year, the World Happiness Report ranks countries by how happy their citizens feel on a 0–10 scale. The headlines are usually the same: Finland is number one, Afghanistan is last, and the Nordic countries dominate the top 10.
But what happens when you look at 14 years of data instead of just one year? The trends tell a more interesting story – one about resilience, shifting regions, and a factor that barely matters at all.
The Setup: Why a Balanced Panel Matters
The dataset covers 168 countries from 2011 to 2025 (2013 is missing). But a simple average across all countries each year is misleading. As lower-scoring countries drop in and out of the survey, the average moves for the wrong reasons.
To fix this, I used a balanced panel: the 129 countries that appear in all 14 measured years. Any trend in this subset is real – not a side effect of changing sample composition.
Finding 1: The World Is Getting Happier – Even Through COVID
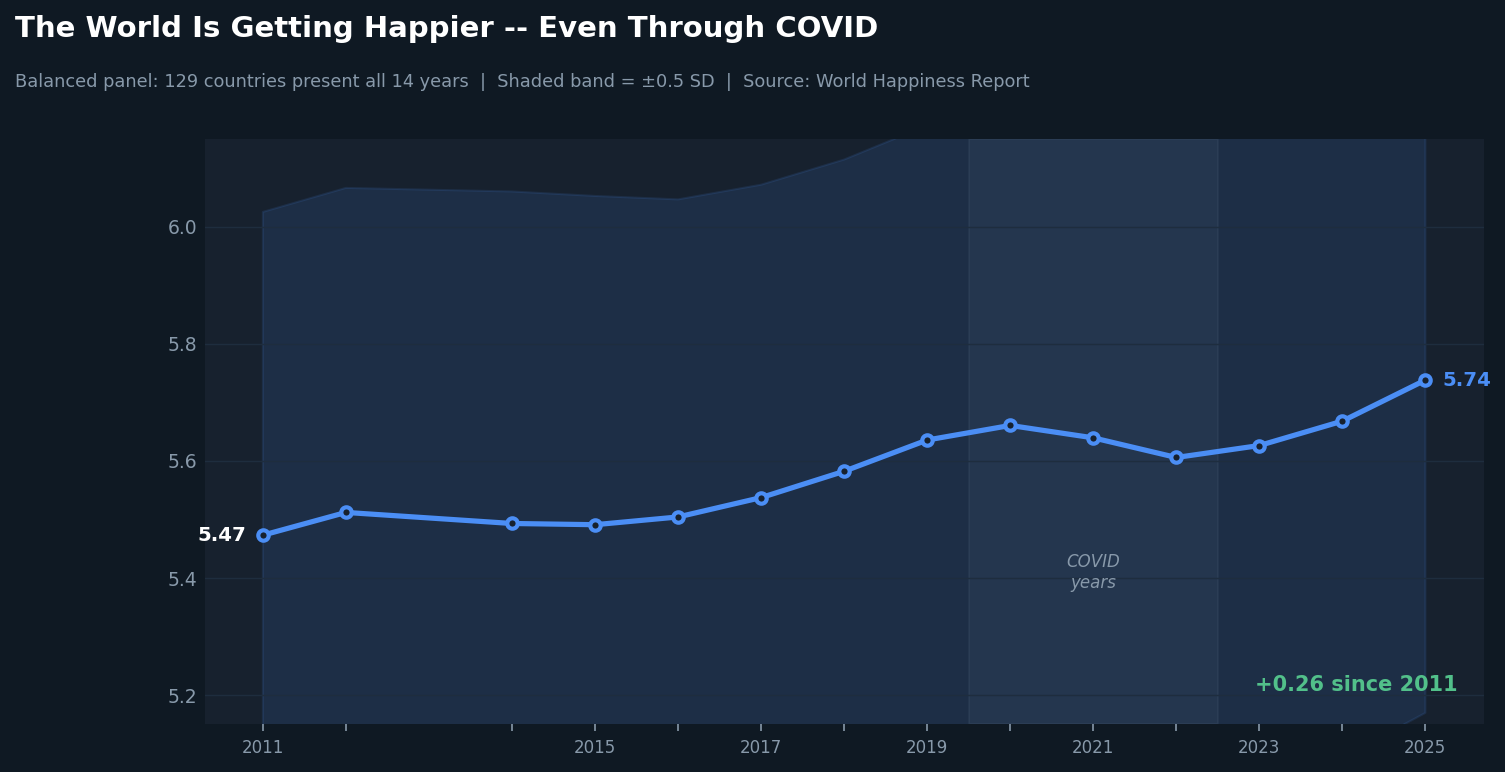
The balanced panel average rose from 5.47 in 2011 to 5.74 in 2025, a gain of +0.26 points over 14 years.
What is surprising is what happened in 2020. The first year of COVID lockdowns, when most people expected global wellbeing to crash, the average actually rose slightly. There was a small dip in 2021 and 2022, then a full recovery by 2023 and a 14-year high by 2025.
Why might this be? The happiness measure used here is the Cantril ladder – “imagine a ladder from 0 at the bottom to 10 at the top, where would you stand today?” It captures overall life evaluation, not moment-to-moment mood. People who kept their jobs, their families, and their health during COVID may have re-evaluated their lives positively. The structural factors that predict happiness – social support networks, trust in institutions, personal freedom – were not destroyed by the pandemic.
Important caveat: This is self-reported and survey-based. It may not capture grief, economic hardship, or anxiety that people did not connect to their overall life rating.
Finding 2: Eastern Europe Is the World’s Fastest-Rising Region
Looking at the top 8 risers from 2011 to 2025, 7 of the 8 are post-Soviet or Balkan countries. China is the exception.
| Country | 2011 Score | 2025 Score | Change |
|---|---|---|---|
| Serbia | 4.56 | 6.69 | +2.13 |
| Bulgaria | 3.89 | 5.70 | +1.81 |
| Georgia | 3.89 | 5.52 | +1.63 |
| Latvia | 4.76 | 6.37 | +1.60 |
| Bosnia and Herzegovina | 4.86 | 6.38 | +1.52 |
| Kosovo | 5.42 | 6.91 | +1.49 |
| Romania | 5.18 | 6.63 | +1.45 |
| China | 4.68 | 6.07 | +1.39 |
These countries started from very low baselines in 2011. The gains reflect rising living standards and institutional development across the post-communist world. Serbia gained more happiness in 14 years than many wealthy nations have accumulated over generations.
The fallers tell a different story – mostly conflict, economic collapse, or governance failure:
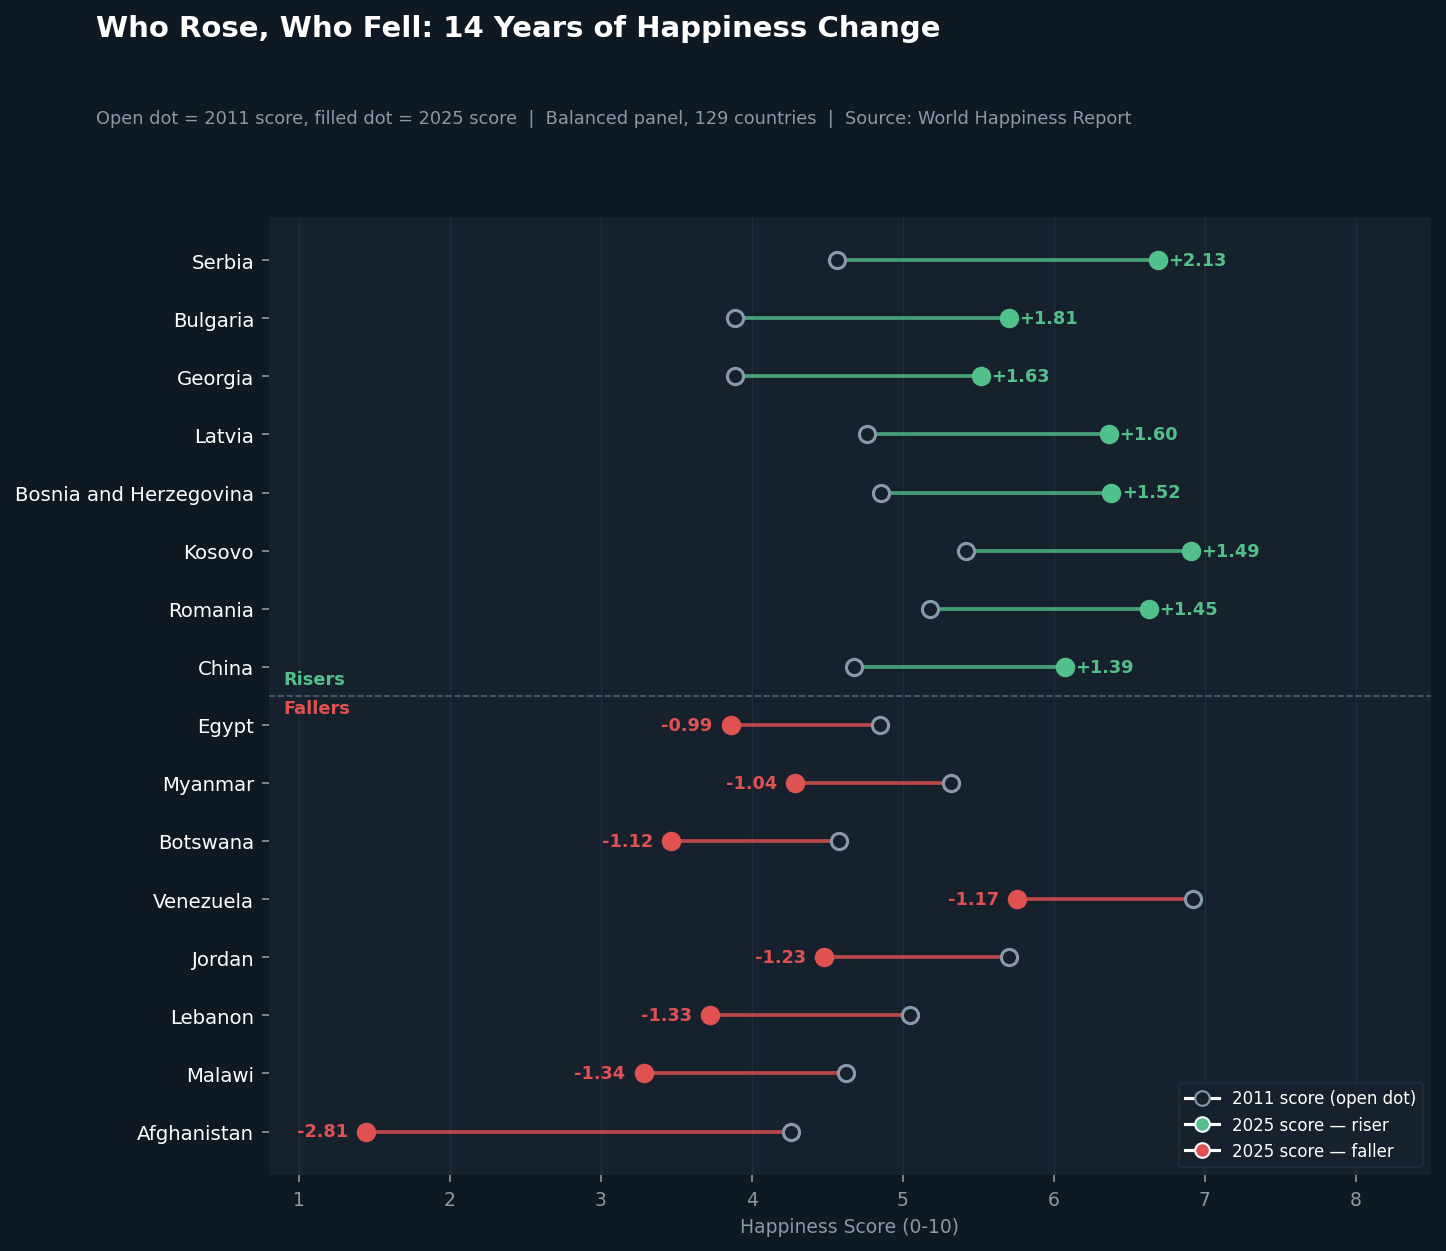
Afghanistan’s decline is the sharpest in the dataset: -2.81 points over 14 years. The score had been falling gradually since 2011 (from 4.26 to 2.57 by 2019), but the Taliban takeover in 2021 accelerated the drop to 1.45 by 2025 – the lowest score in the world.
Lebanon (-1.33), Malawi (-1.34), and Jordan (-1.23) show how economic collapse and regional instability erode wellbeing over time.
Finding 3: The Gap Is Not About Money Alone
In 2025, the top 10 happiest countries (Finland, Iceland, Denmark, Costa Rica, Sweden, Norway, Netherlands, Israel, Luxembourg, Switzerland) score an average of 7.33. The bottom 10 score 3.36 – a 4-point divide.
Each happiness score is built from six measured factors plus a baseline component. When you stack those factors for the two groups, the gap becomes visible:
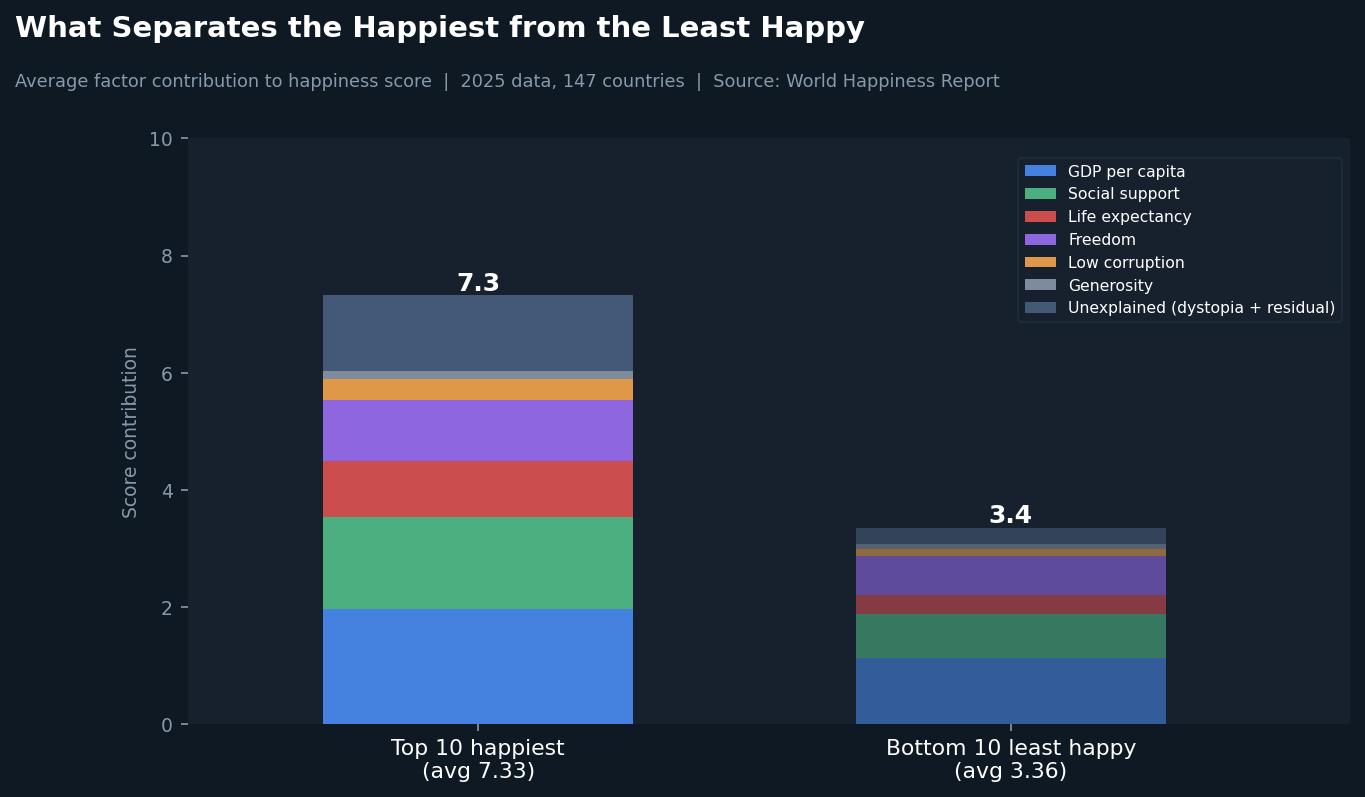
The biggest raw gaps between the two groups:
- GDP per capita: 1.96 (top 10) vs 1.13 (bottom 10) – gap of 0.83 points
- Social support: 1.58 vs 0.76 – gap of 0.82 points
- Life expectancy: 0.95 vs 0.32 – gap of 0.62 points
GDP has the largest absolute gap, but social support is close. The bottom 10 are not only poorer – they also score significantly lower on having people to count on in a crisis, and on living long enough to accumulate life satisfaction. These structural deficits compound each other.
Finding 4: What Actually Predicts National Happiness
Using factor data from 2019 to 2025 (1,013 country-years), I measured the correlation of each factor with the final happiness score:
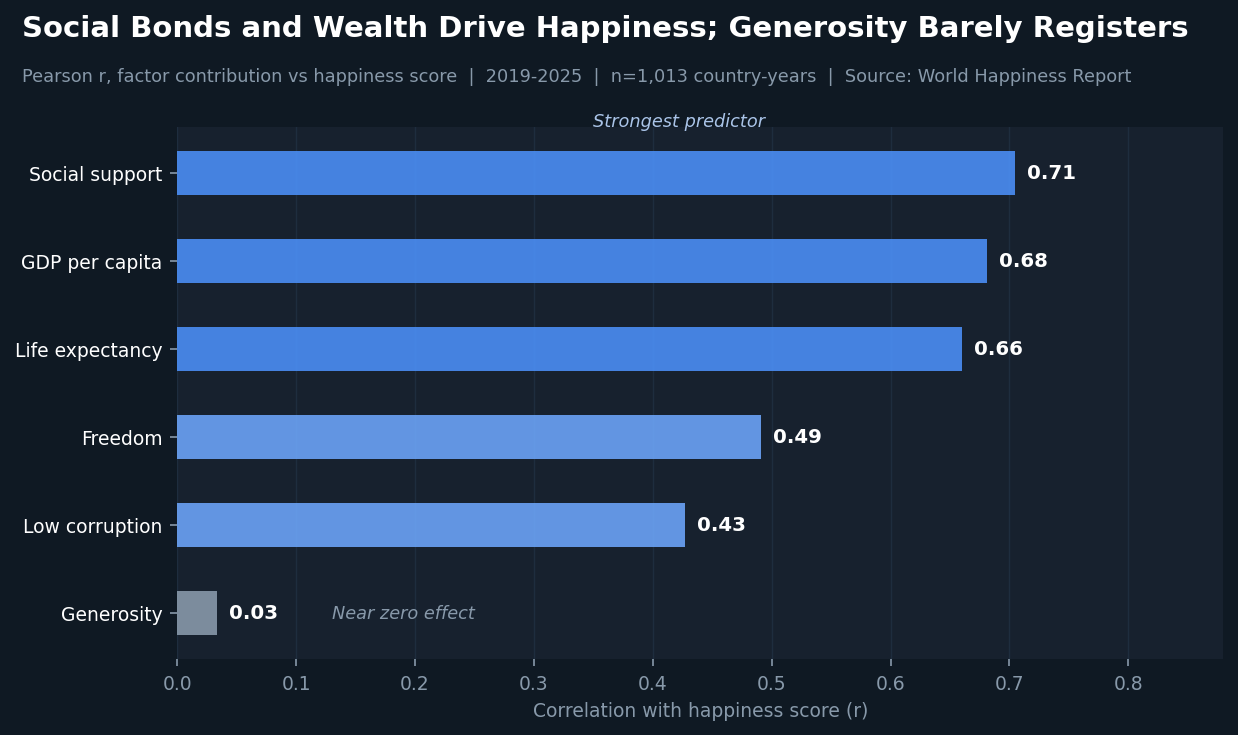
Three factors cluster tightly at the top: social support (r=0.71), GDP per capita (r=0.68), and life expectancy (r=0.66). They are all strongly correlated with each other – wealthier countries tend to have better healthcare and stronger safety nets – so separating their individual effects is difficult.
The outlier finding: generosity has a near-zero correlation (r=0.03) with national happiness. Countries where people report giving more to charity are not systematically happier at the national level. This does not mean generosity is meaningless for individuals – but it does not move the needle at country scale.
Freedom and low corruption matter, but less than the top three. Material and social security appears to have a larger effect than political conditions alone.
Finding 5: The Happiness Gap Is Widening
While the global average rises, the gap between the happiest and least happy countries is growing.
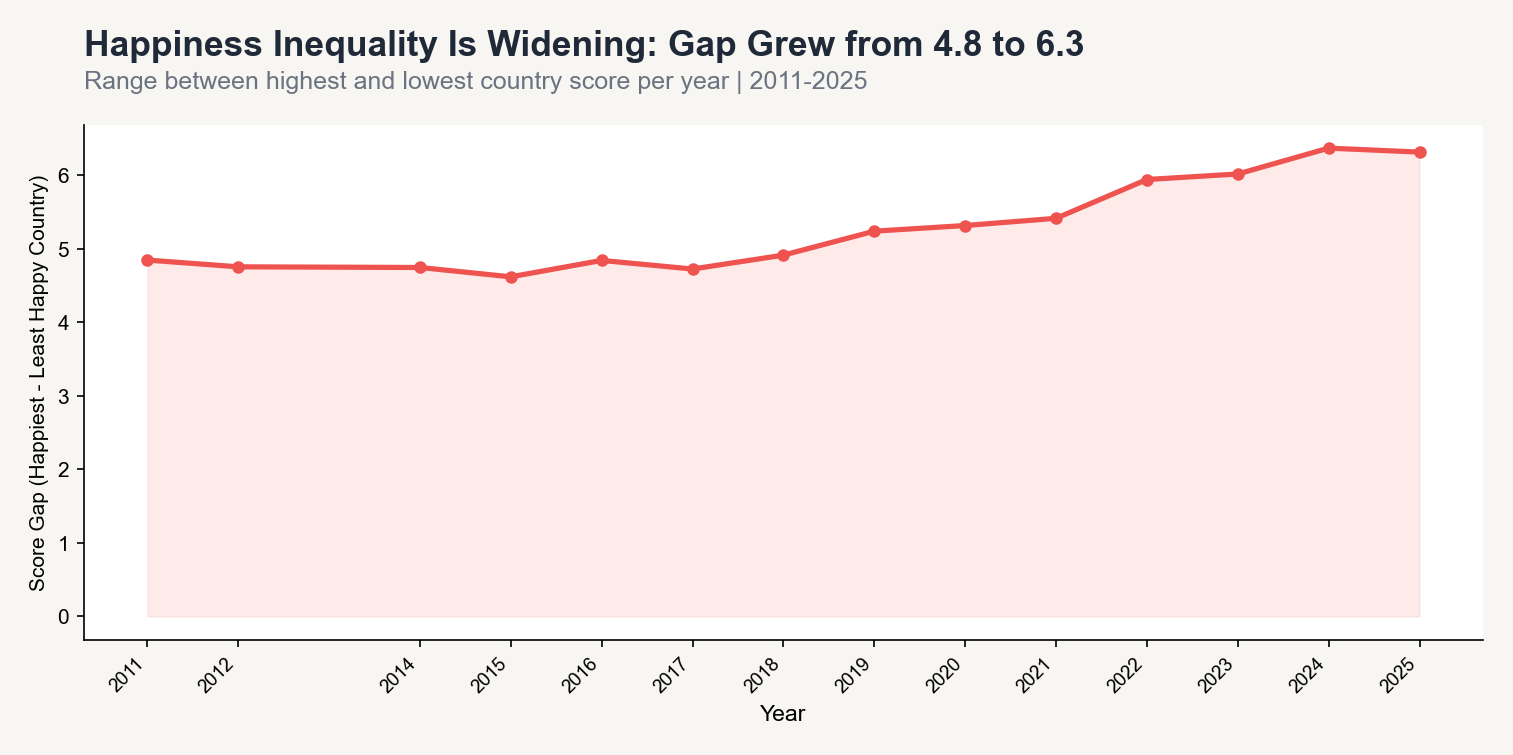
The range between the top and bottom country score grew from 4.8 points in 2011 to 6.3 points in 2025 – a 31% increase. The rising average is real. But the countries that need improvement most are not keeping pace with the countries already at the top.
This matters for how we read the headline trend. A world where the average rises because the top keeps climbing is a different story from a world where the bottom catches up. The data shows the former.
Three Takeaways
1. Resilience is real. The data does not support the narrative that COVID caused a global happiness crash. The decline was minor and short-lived. Human wellbeing is more durable than crisis headlines suggest.
2. Post-communist countries are the biggest comeback story. A decade of institutional development and rising living standards has driven some of the largest happiness gains ever recorded. This pattern is worth watching over the next decade.
3. Generosity is not what you think. At the national level, how much people donate has almost no relationship with how happy they are. Social support – having someone to count on – matters far more. The difference: generosity is an act; social support is a structure.
Methodology notes:
- Balanced panel of 129 countries (all 14 measured years). Year 2013 missing from source data.
- Factor data (explained components) available from 2019 onward only.
- All factors verified to sum to the happiness score (max rounding error: 0.003).
- Self-reported Cantril ladder scale, not objective wellbeing measure.
Code & Data: View the analysis scripts here