Netflix: Why Older Movies Can Support Growth
In brief
A catalog analysis that separates TV and movie freshness, genre mix, director concentration, and UK metadata coverage.
Executive summary
Decision: should Netflix use one freshness target for both TV shows and movies? Finding: among US additions from 2015 to 2021, same-year TV acquisitions rose while the movie share fell. Deep-library share also rose in two movie clusters. Recommendation: track content types separately and check metadata completeness. The catalog file does not measure viewing, retention, or licensing economics.
Problem - one freshness score can hide different catalog roles
From 2015 to 2021, the share of US catalog additions released in the same year fell from 72.2% to 28.1%. If a team reads that single trend as a decline in catalog quality, it may miss different patterns for TV shows and movies.
The business question is: should catalog investment be judged by one freshness target, or do TV and movies need separate goals?
Hypotheses - what could explain the freshness decline?
- The content mix may be changing. If TV becomes fresher while movies become older, one combined measure can hide both patterns.
- The shift may be concentrated in selected movie groups. Compare deep-library shares by genre cluster rather than assuming the whole movie catalog changed equally.
- Recent titles may have weaker metadata. Check core catalog fields by release vintage before treating discoverability as the cause.
Analysis - what did the catalog snapshot show?
The analysis uses 8,807 Netflix titles from the Movies and TV Shows dataset, with a Zenodo preservation copy. It calculates acquisition lag as year added minus release year. The freshness and genre-cluster comparisons below use US additions; the metadata check uses UK titles grouped by release decade. These are descriptive catalog measures, not business outcomes.
I owned the data checks, acquisition-lag analysis, cluster interpretation, metadata review, and decision framing. The source does not include viewing, retention, or licensing-cost outcomes.
TV additions became fresher while movies shifted toward older titles
The share of US TV additions released in the same year increased from 40.0% in 2015 to 61.1% in 2021. The same-year share for movies fell from 84.6% to 14.0%. The combined result therefore hides opposite movements between the two content types.
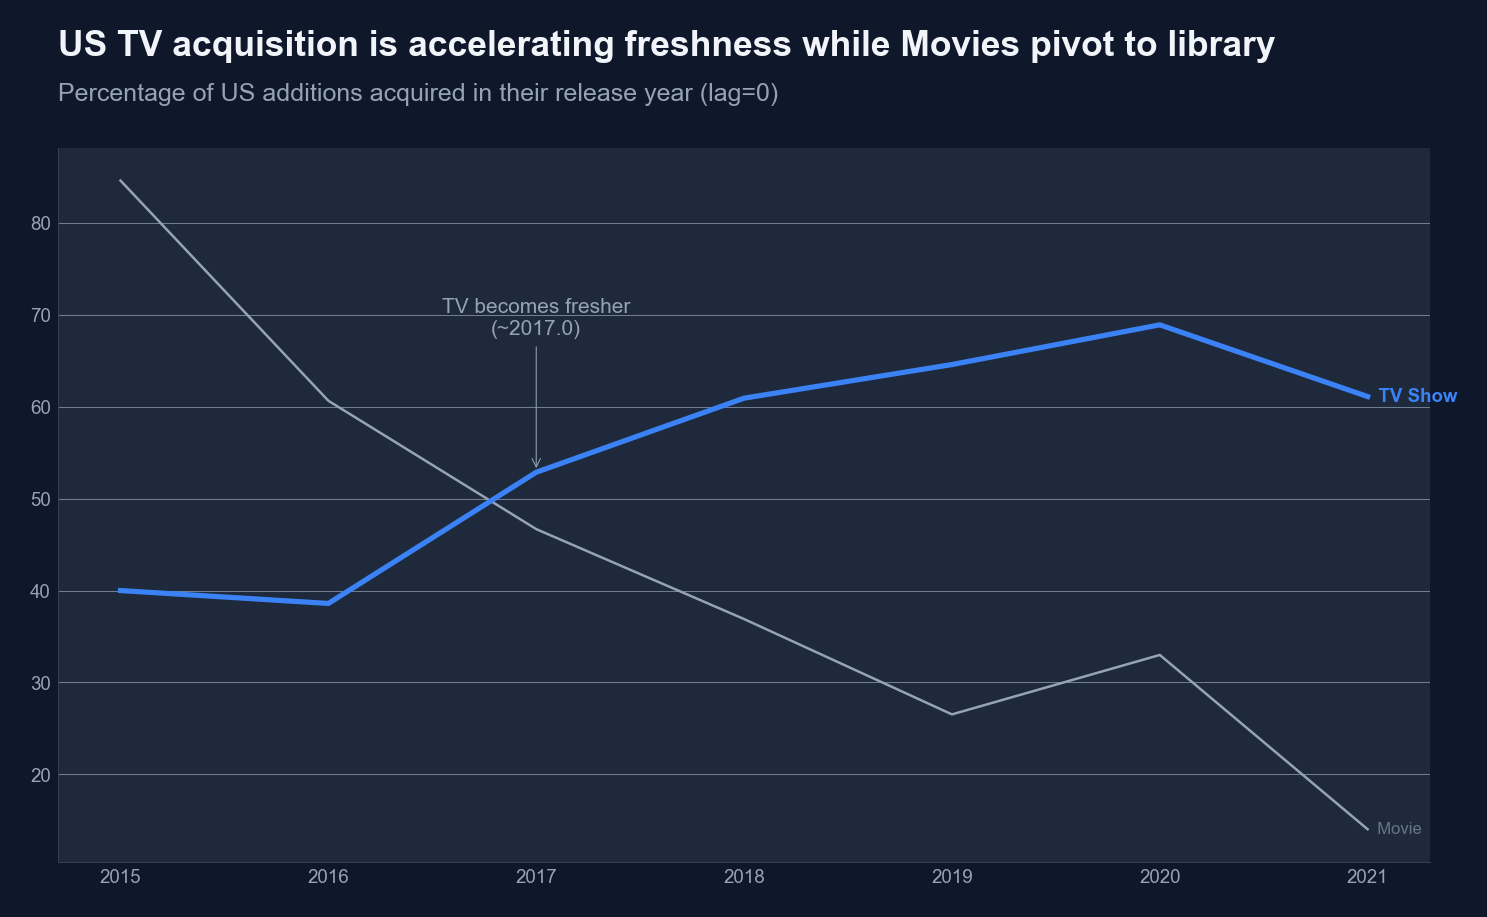 Scroll horizontally to inspect chart labels.Chart takeaway: US Netflix additions from 2015 to 2021: same-year TV acquisitions rose to 61% while movies fell to 14%
This supports separate freshness measures. It does not show that either trend improved viewing or retention.
Deep-library share grew most in international-drama and family clusters
The analysis defines deep-library titles as having an acquisition lag over five years. From 2015 to 2017 versus 2018 to 2021, that share rose from 5.5% to 47.4% in the international-drama cluster and from 16.4% to 48.0% in the children-and-family cluster. The unsupervised groups are named from their strongest genre signals; they do not prove Netflix's intent.
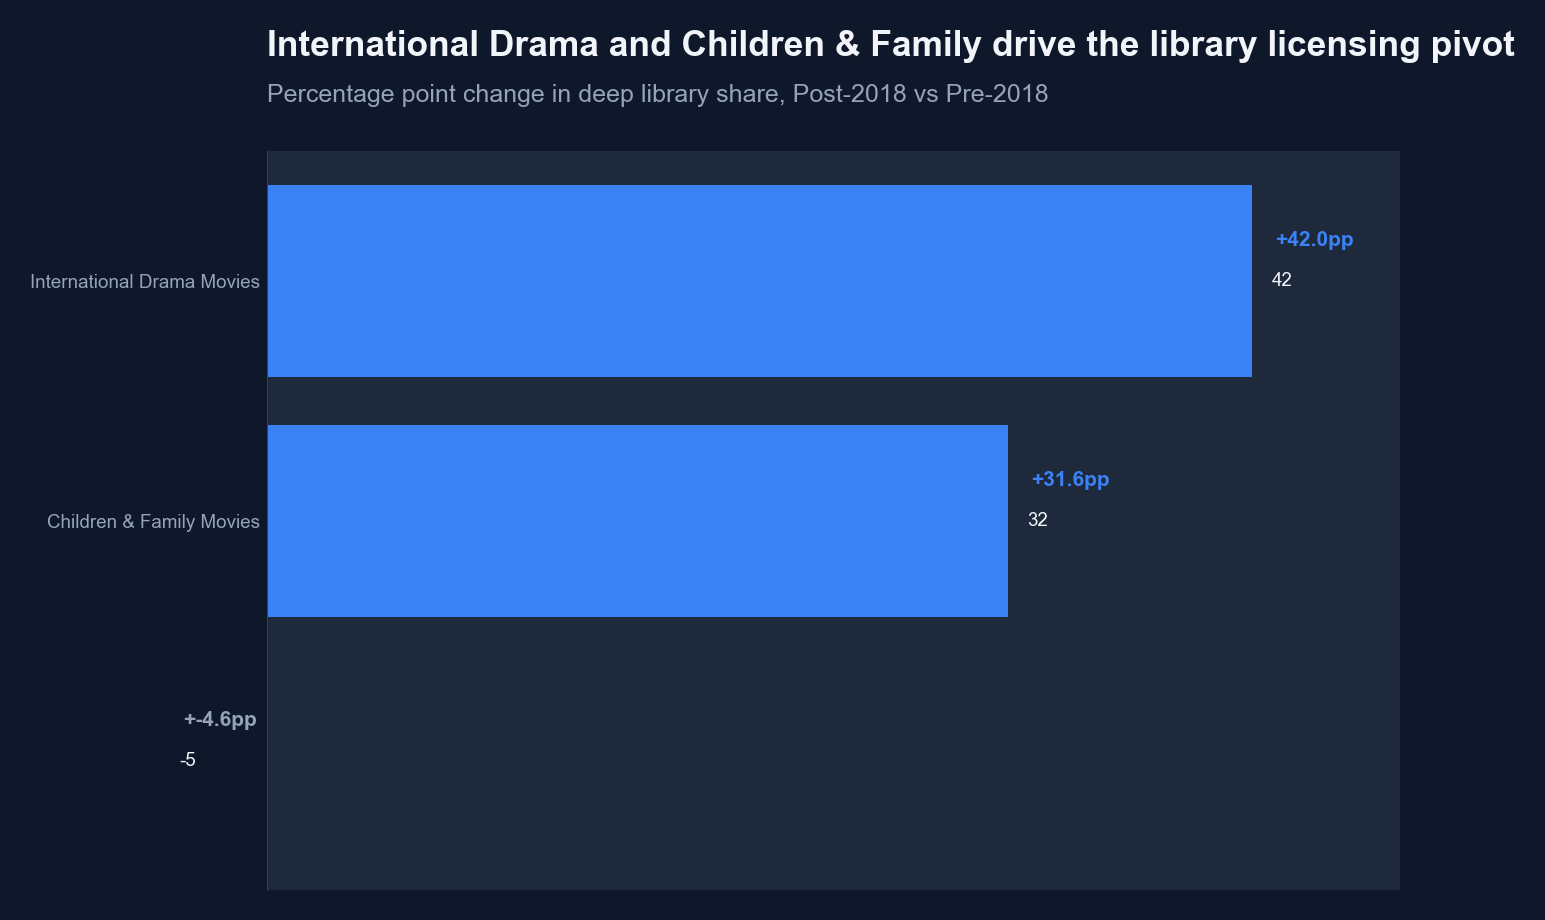 Scroll horizontally to inspect chart labels.Chart takeaway: US movie additions from 2015 to 2021: deep-library share rose 42.0 points in international dramas and 31.6 points in children and family movies
The 50 most prolific directors had a different genre mix
Among 5,941 movies with a recorded director, the 50 most prolific directors accounted for 421 titles. Documentaries made up 13.4% of all attributed movies but 1.4% of the top-50 group. Children-and-family movies made up 10.2% of the full group and 18.1% of the top-50 group.
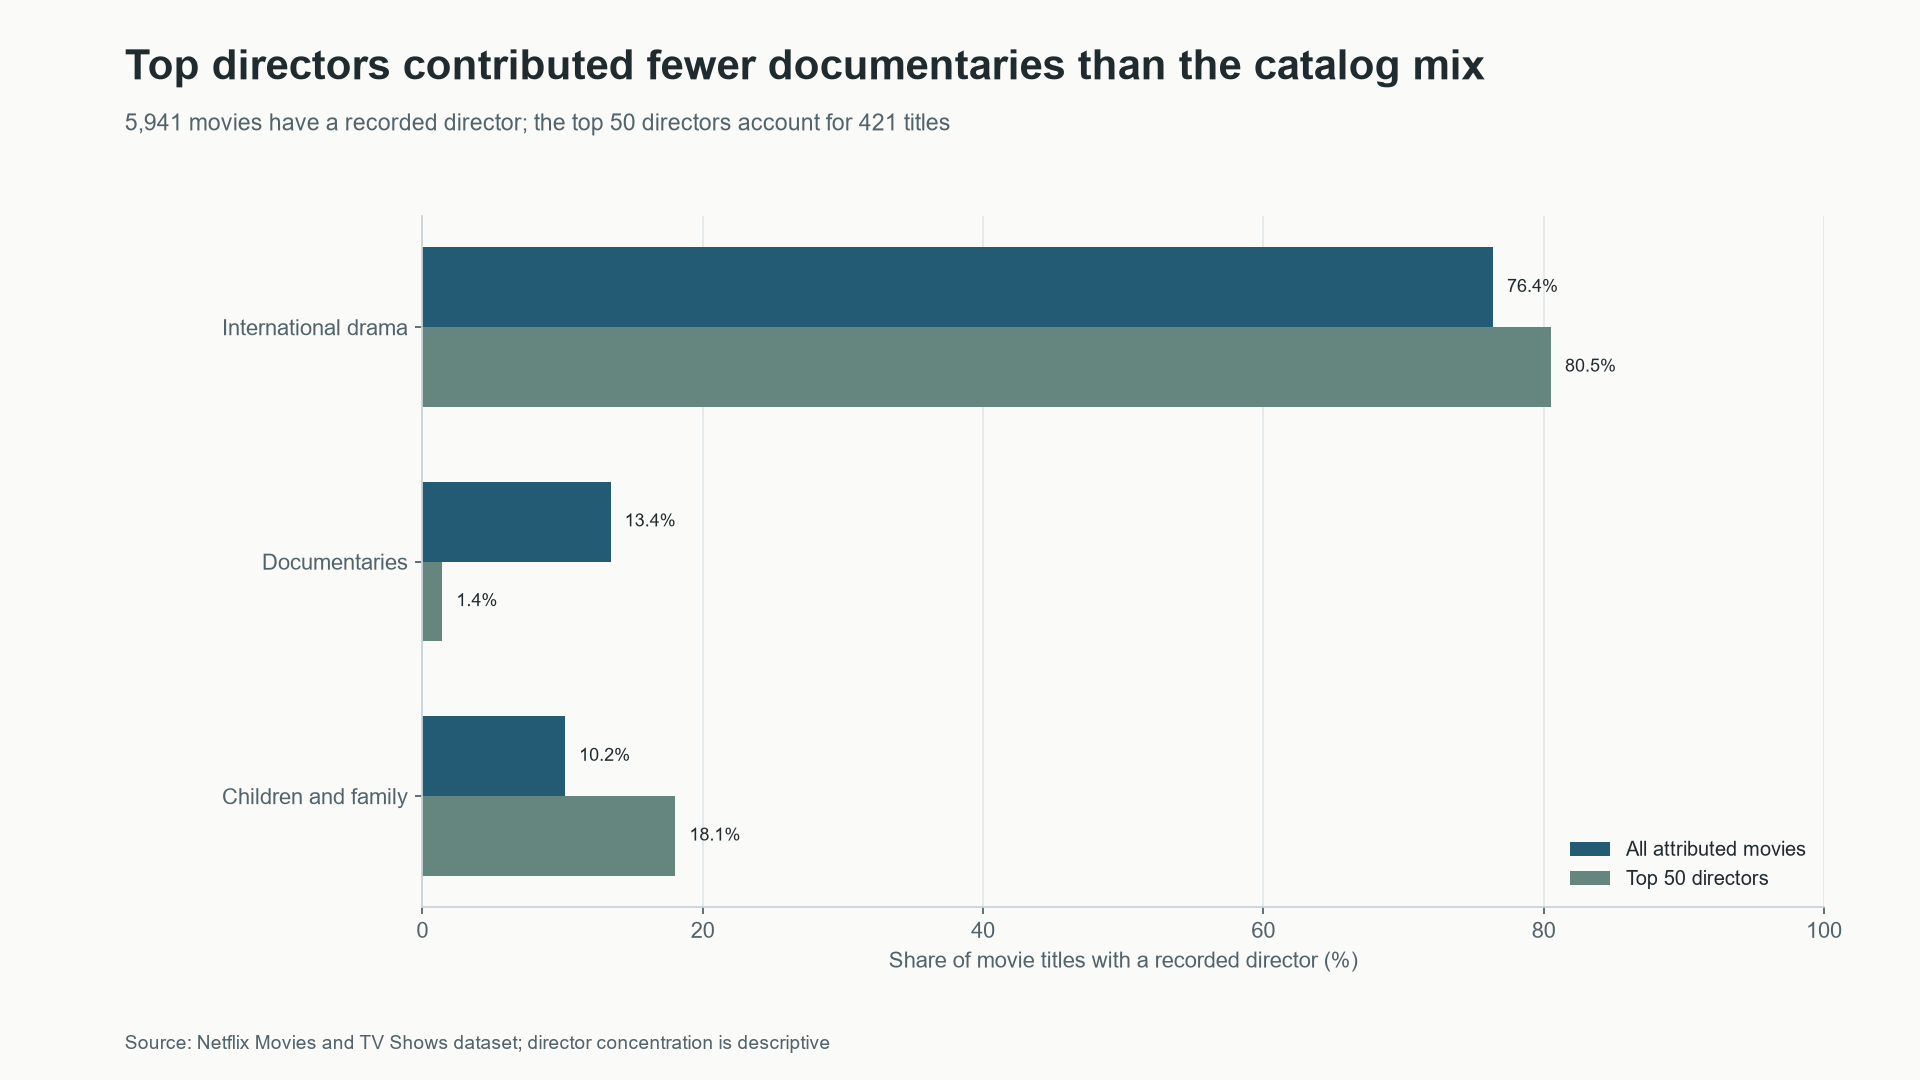 Scroll horizontally to inspect chart labels.Chart takeaway: Among movies with recorded directors, the top 50 directors had fewer documentary titles than the catalog mix
This describes the mix of titles from prolific directors. It does not measure repeat partnerships, negotiation effort, or whether a different mix performs better.
Sparse core metadata was more common for recent UK release vintages
For titles with a UK primary country, 12.8% of titles released in the 2020s had at least two missing values among director, cast, and country. The rate was 6.3% for the 2010s. This uses release year, not the year a title was added. It does not measure description or genre-tag completeness.
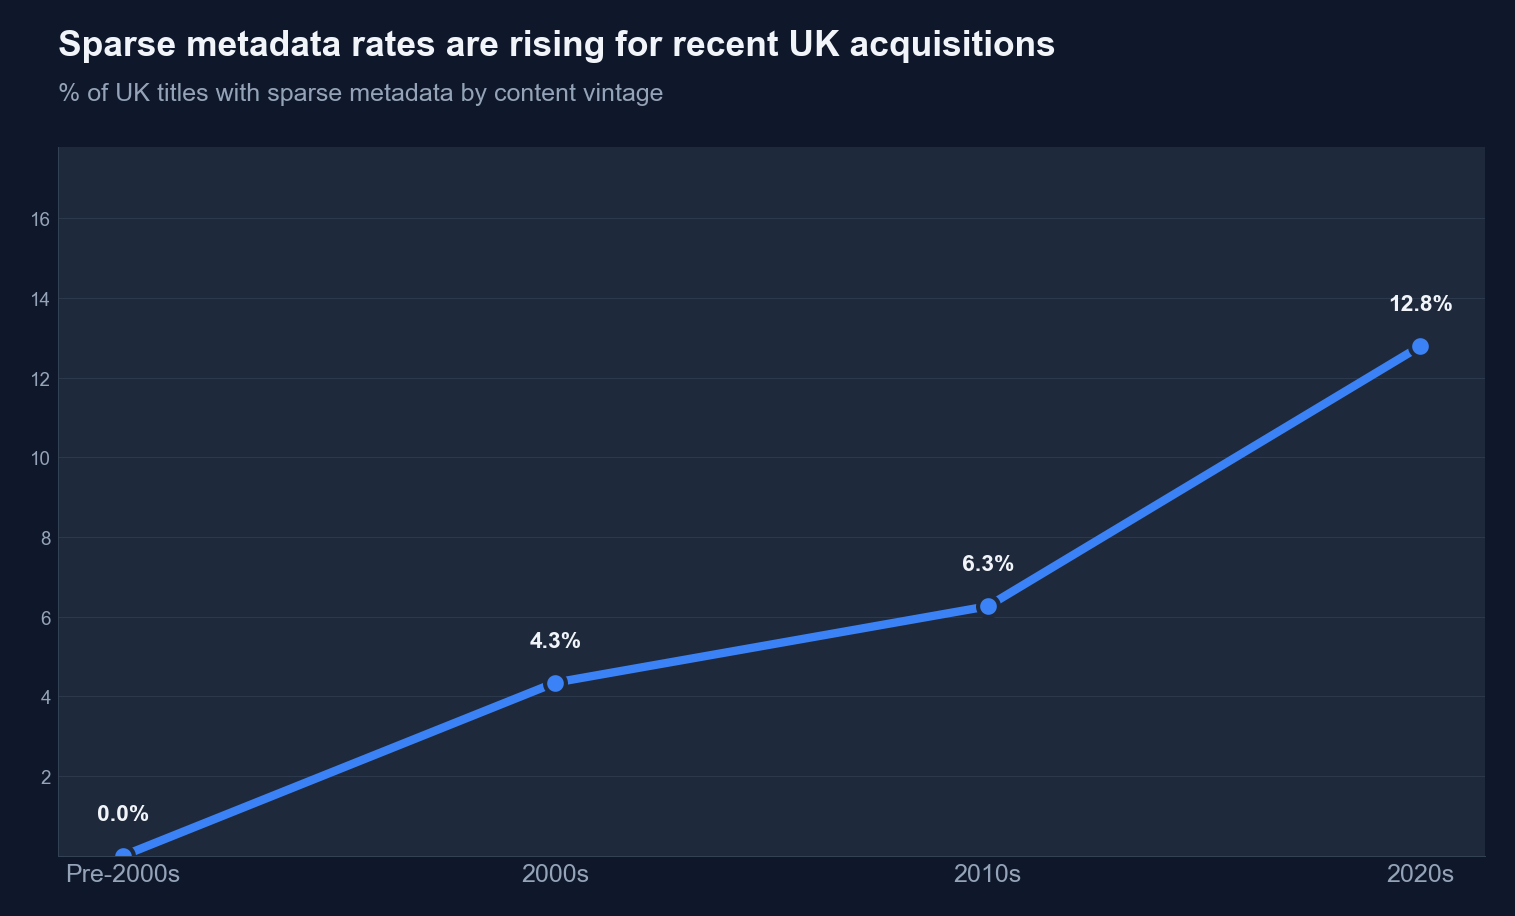 Scroll horizontally to inspect chart labels.Chart takeaway: UK Netflix titles by release vintage: 12.8% of 2020s releases had sparse director, cast, or country metadata
The gap supports a metadata coverage check. It does not establish why fields are missing or how the gaps affect discovery.
Result - separate the targets and verify customer outcomes
The evidence supports two hypotheses: TV and movie freshness moved in opposite directions, and selected movie groups shifted toward deeper catalog content. The metadata check also found more missing core fields in newer UK release vintages. None of these observations proves customer impact or intentional licensing strategy.
- Set separate freshness goals for TV and movies.
- Track deep-library share by genre group, while keeping the cluster labels descriptive.
- Check director, cast, and country coverage for recent releases. Measure description and tag completeness separately before using those fields in a discovery claim.
- Validate any content strategy against viewing, retention, licensing cost, and customer search outcomes.
Technical notes
The source snapshot contains 8,807 unique title IDs. Acquisition lag is year added minus release year; negative lags are excluded. Five KMeans groups were built from the 15 most common genres, content type, rating tier, and lag band. Group labels use dominant genre signals and should not be read as Netflix-defined segments. The UK metadata score uses director, cast, and country fields only.
Regeneration instructions and source hashes are in legacy_jekyll/scripts/netflix/README.md. The workbook is downloadable from Zenodo and linked to the original Kaggle dataset.