NYC Restaurant Inspections: Where Quality Risk Needs Attention
In brief
A messy inspection-data analysis showing how a restaurant group could prioritize quality support without treating every location as the same risk.
Executive summary
Business problem: focus food-safety preparation and follow-up where repeat risk is highest. Key findings: the selected inspection base has a 77.3% critical-violation rate; Staten Island and the Bronx are above the city rate; and many records have no grade. Business impact: borough averages can prioritize attention but do not prove cause. Recommended action: target repeat critical findings while protecting inspection coverage and data quality.
Business context
Food quality is both a customer trust issue and an operating risk. A restaurant group cannot act on a raw list of violation records alone because one inspection may create several rows, grades may be missing, and some records contain placeholder dates.
Business question
How can a restaurant operator use public inspection data to prioritize quality coaching and follow-up visits?
How I approached it
I used the current NYC Open Data extract, kept inspections from 2022 through 2025, and rolled repeated violation rows up to restaurant, inspection date, and inspection type. I then compared grade outcomes, maximum inspection score, and whether an inspection included at least one violation marked critical.
Finding 1: The raw data needed an inspection-level view
The public extract contains 295,256 violation records, but they are not the same as 295,256 inspections. After filtering to 2022-2025 and rolling rows up, the analysis produced 73,478 inspection records.
The extract also includes 150,141 missing grades, 160,467 missing grade dates, and 17,159 missing scores, plus placeholder dates such as 1900-01-01. These are not small technical details: using raw row counts would overstate inspection volume and missing grades would make a simple grade ranking misleading.
Finding 2: Most recorded grades were A, but the ungraded cases still matter
Among the inspection records with an A, B, or C grade, 85.8% were A, 9.3% were B, and 4.9% were C. However, 30,129 rolled-up inspection records had no grade in this extract.
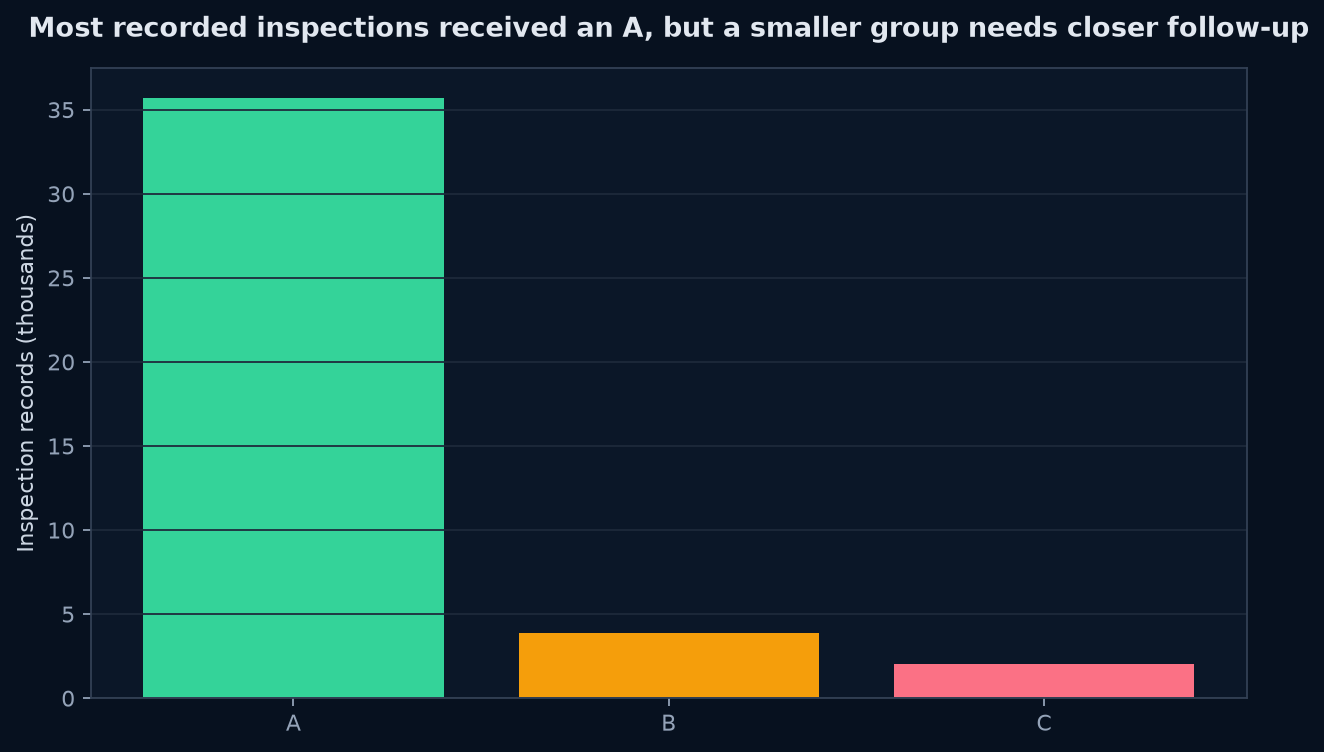 Chart takeaway: 73,478 NYC inspections from 2022–2025: Most recorded grades were A, but 30,129 inspections had no grade for follow-up
Business meaning: A strong A-grade share does not mean every location is low risk. The ungraded group needs a separate workflow because it may represent inspections before a grade was assigned or records where the current extract does not contain the final outcome.
Finding 3: Critical-violation rates differed by borough
In the 2022-2025 inspection-level roll-up, 77.3% of records included at least one violation marked critical. The rate ranged from 75.9% in Manhattan to 81.6% in Staten Island. The Bronx was next at 79.7%, followed by Queens at 78.2% and Brooklyn at 77.1%.
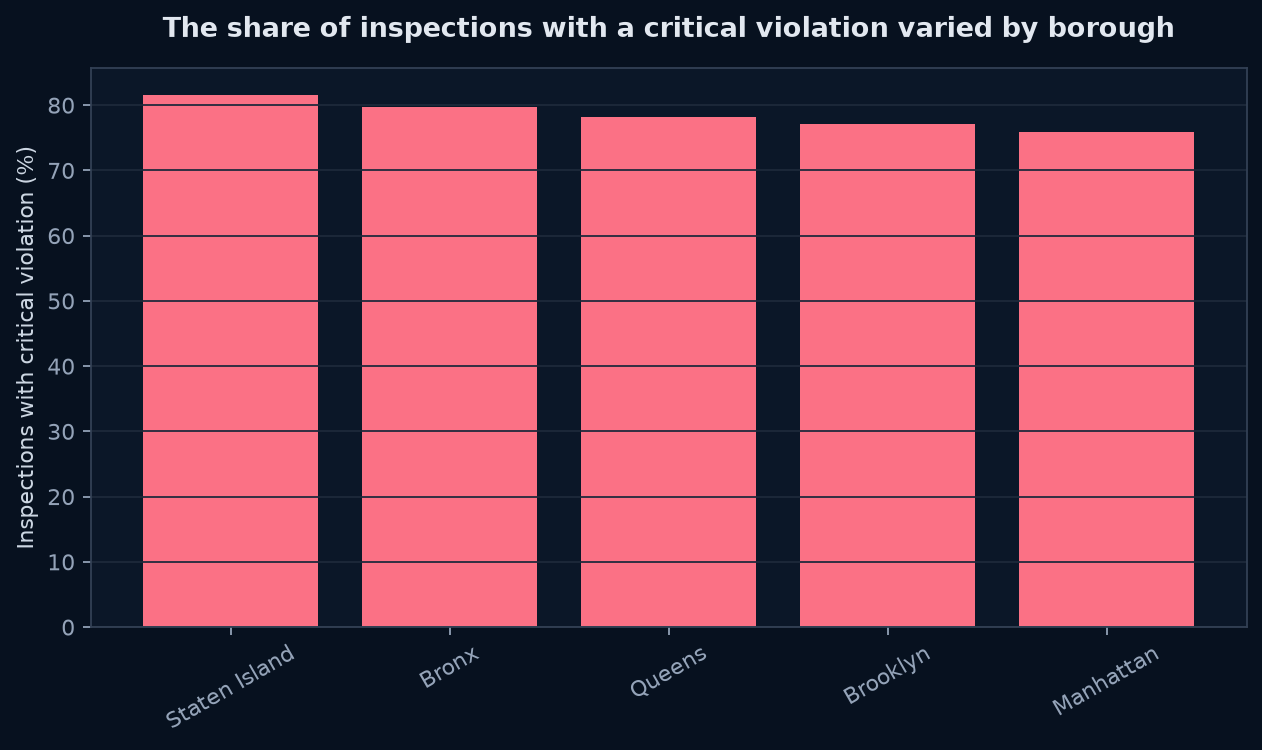 Chart takeaway: 73,478 NYC inspections from 2022–2025: Critical-violation rates ranged from 75.9% in Manhattan to 81.6% in Staten Island
These differences are useful for prioritization, but they do not prove that a borough causes worse performance. Restaurant mix, inspection timing, location, and reporting practices may all contribute.
Recommendations
- Use a two-level quality queue. Send immediate coaching to locations with recent critical violations or low grades, then review ungraded inspections separately instead of treating them as clean.
- Start a borough-level pilot. Compare the Bronx and Staten Island with Manhattan using the same inspection-level definitions, then test whether targeted coaching changes the next inspection result.
- Track repeat outcomes by restaurant. A restaurant-level history is more useful than a one-time citywide ranking. Measure whether critical violations recur after follow-up.
- Keep the data limitations visible. Do not use this public extract alone to rank managers or predict customer demand; pair it with internal visit, complaint, and operating data.
Takeaway
Public inspection data can support a useful quality-prioritization system, but only after the business changes the unit of analysis from violation rows to inspections and treats missing outcomes as a follow-up queue rather than a clean result.
Senior decision frame
Decision owner: Director of Restaurant Operations. Decision: where should inspection-preparation and follow-up resources go first? North-star KPI: share of inspections with a critical violation. Drivers: borough, inspection type, restaurant, and repeat inspection history. Guardrails: inspection coverage, time since last inspection, and the rate of missing grades.
What is driving the result?
The 2022–2025 inspection-level base has a 77.3% critical-violation rate after rolling violation rows up to restaurant, inspection date, and inspection type. The rate is highest in Staten Island (81.6%) and the Bronx (79.7%) and lowest in Manhattan (75.9%). This is a prioritization signal, not proof that borough causes risk: inspection mix, restaurant type, and reporting completeness may differ.
The outcome is also incomplete. Only 35,700 inspection records have an A grade, while 30,129 have no grade in the selected period. A missing grade must not be treated as a pass.
Opportunity, trade-offs, and validation
The immediate opportunity is to focus review on the two boroughs above the city rate, then test whether risk falls after targeted education or follow-up. No financial impact is estimated because the data has no sales, closure cost, or customer-complaint fields. A lower violation rate could also reflect changed inspection coverage, so coverage is a guardrail.
- P0 — Act now: review restaurants and inspection types in Staten Island and the Bronx with repeat critical findings.
- P1 — Test: compare a targeted food-safety support group with similar restaurants receiving standard communication.
- P2 — Investigate: add restaurant type, inspection schedule, closure outcomes, and complaint data.
Success means a lower repeat-critical rate without reducing inspection coverage. Sensitivity checks should exclude placeholder dates, separate inspection types, and report graded records separately from missing grades.
Supporting technical detail
The source is the NYC Restaurant Inspection Results dataset. The catalog says the data is public but does not list an explicit license, so the source and attribution are retained. The source also warns that administrative records may contain illogical values caused by data-entry or transfer errors. This analysis uses 2022-2025 records, groups by camis, inspection_date, and inspection_type, takes the maximum score within an inspection, and marks an inspection as critical when any associated violation has critical_flag = Critical.
Dataset details: View the NYC Open Data source