NYC Taxi Operations: Matching Capacity to the Right Trips
In brief
A large-scale trip analysis showing when demand peaks and why airport-linked trips need a different operating plan.
Executive summary
Business problem: match vehicle capacity to demand and trip economics. Key findings: valid trips peak at 18:00; Manhattan contains about 89% of valid trips; and airport-linked trips are longer and higher-fare. Business impact: one all-day operating plan will miss the most valuable demand differences. Recommended action: protect the evening peak and test a separate airport operating lane.
Business context
Taxi operators have to make decisions about where to position vehicles, when to add capacity, and which trips deserve a different service plan. A monthly trip file can answer those questions if the analysis separates demand volume from trip economics.
Business question
When and where should a taxi operator focus capacity, and which trip types should be managed as a separate operating lane?
How I approached it
I used the January 2025 yellow taxi trip file and joined pickup location IDs to the TLC taxi-zone lookup. I removed records with non-positive distance or fare and excluded trips shorter than one minute or longer than two hours. I then compared trip volume, duration, and average fare by pickup hour and borough.
Finding 1: The busiest demand window was the early evening
Valid trips peaked at 241,585 pickups at 18:00, with demand also high at 17:00 and 19:00. Manhattan accounted for 2.96 million of 3.31 million valid trips, or about 89% of the cleaned sample.
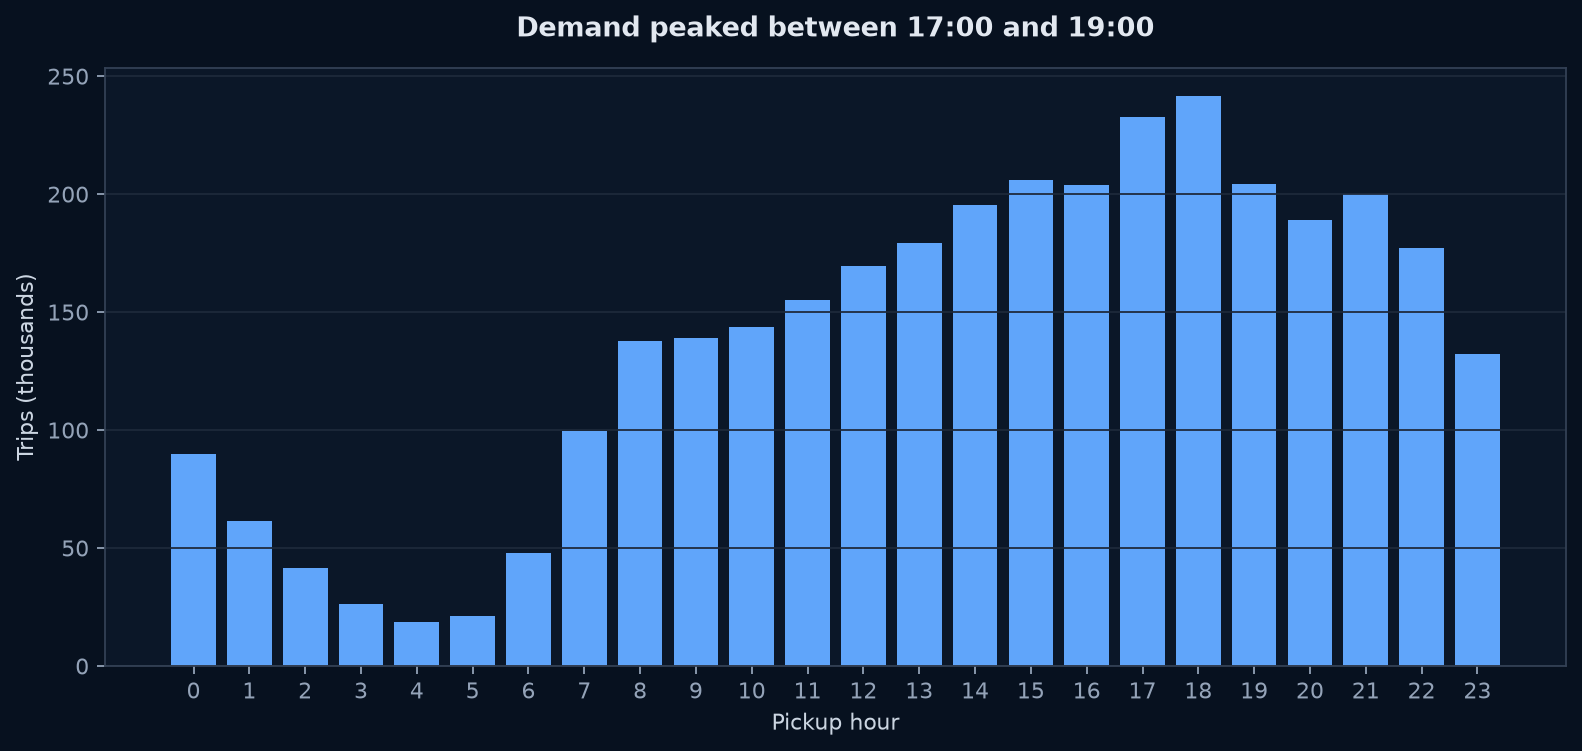 Chart takeaway: January 2025 NYC yellow-taxi trips: Demand peaked at 18:00, with the strongest operating window from 17:00 to 19:00
Business meaning: A broad, all-day capacity plan would miss the most important window. Vehicle availability and dispatch coverage should be strongest before and during the evening peak.
Finding 2: Airport-linked areas had a different trip profile
Queens pickups averaged 32.0 minutes and $72.12 per trip, compared with 12.8 minutes and $22.34 in Manhattan. The JFK Airport pickup zone alone recorded 133,337 valid trips, with an average duration of 38.4 minutes and an average fare of $81.11.
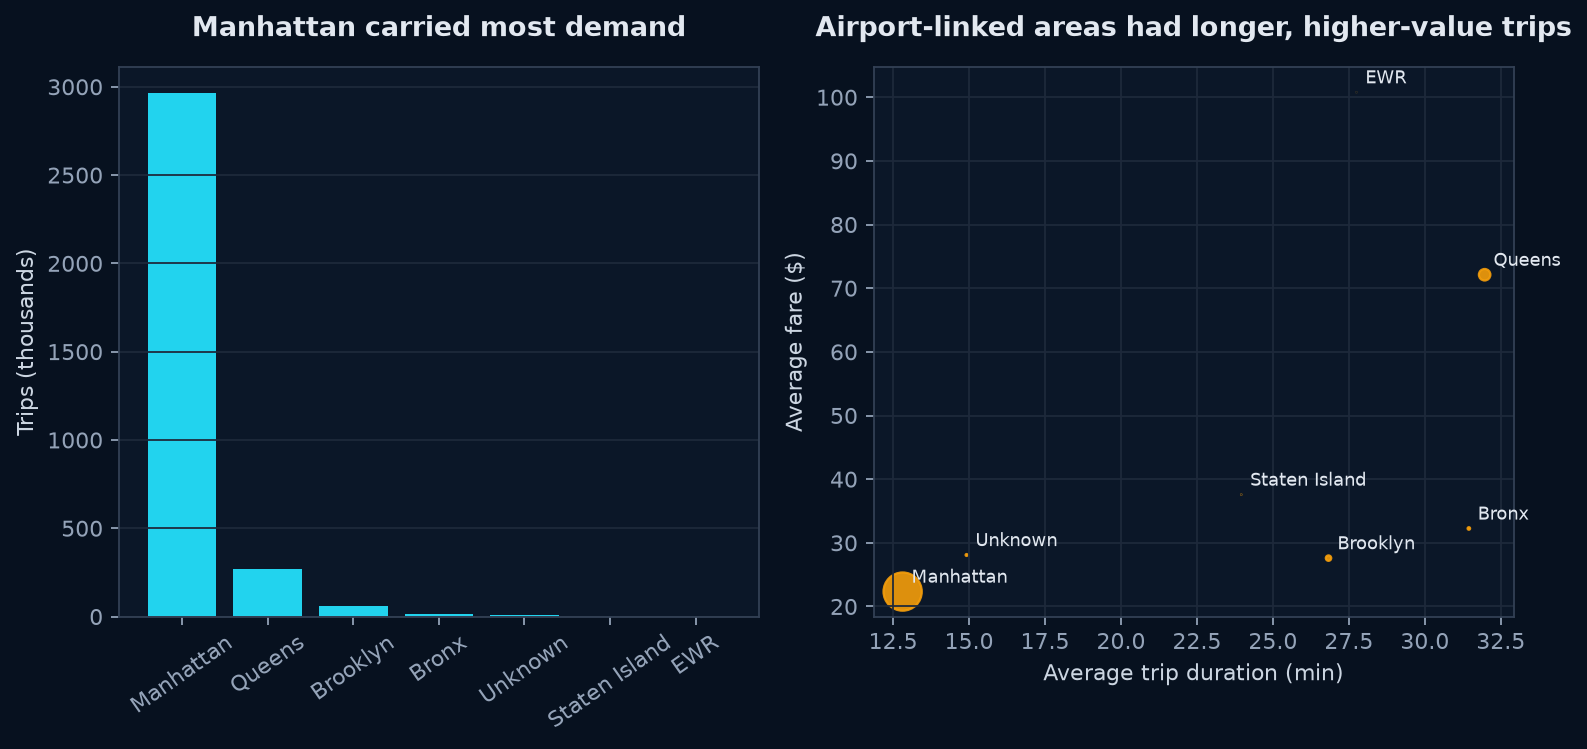 Chart takeaway: January 2025 valid NYC yellow-taxi trips: Manhattan carried most volume, while airport-linked areas had longer, higher-fare trips
These trips are not directly comparable with short Manhattan trips. They use vehicles for longer periods, involve different pickup patterns, and create different revenue per trip. Treating every zone as the same operating problem would hide that difference.
Finding 3: Data quality could change the operating picture
The raw file contains 3,475,226 rows, but 90,893 have non-positive trip distance and 145,516 have non-positive fare amounts. Optional fields such as passenger count and rate code are also missing in more than 540,000 rows.
Business meaning: The demand pattern is useful for planning, but any dispatch or revenue scorecard should publish its cleaning rules. Otherwise, invalid records can distort zone comparisons.
Recommendations
- Protect 17:00-19:00 capacity in Manhattan. Use the evening peak as the first staffing and vehicle-positioning test.
- Manage airport-linked service separately. Track JFK and other airport zones with their own targets for trip duration, revenue per trip, and vehicle utilization.
- Review zone performance with both volume and value. High demand does not automatically mean the best economics; compare trips, time occupied, and fare together.
- Make data-quality rules part of the operating report. Keep invalid-distance and invalid-fare counts visible so decisions are based on a known denominator.
Takeaway
The biggest operational opportunity is not simply adding more taxis. It is matching capacity and service rules to two different patterns: high-volume evening demand in Manhattan and longer, higher-value airport-linked trips.
Senior decision frame
Decision owner: Operations Director. Decision: where should vehicles and dispatch capacity be concentrated? North-star KPI: completed trips per available vehicle-hour. Drivers: demand by hour, pickup geography, trip duration, and fare. Guardrails: passenger experience, deadhead time, safety, and driver utilization, which are not measured in this extract.
What is driving the result?
The problem is concentrated rather than city-wide. Manhattan provides 2.96m of 3.31m valid trips, while Queens trips average 32.0 minutes and $72.12, compared with 12.8 minutes and $22.34 in Manhattan. JFK alone contributes 133,337 trips at an average $81.11. This supports separate peak-city and airport operating lanes; it does not prove that moving vehicles will create incremental demand.
Opportunity scenarios and trade-offs
If an airport service test created only 1% more JFK-linked trips at the observed average fare, gross fare exposure would be about $108,000 (133,337 × 1% × $81.11) before vehicle cost. The conservative case should use 0.5%, the expected case 1%, and the ambitious case 2%. The trade-off is that airport trips consume more time, so higher fare per trip may not mean higher fare per vehicle-hour.
Prioritized action and measurement
- P0 — Act now: protect 17:00–19:00 Manhattan coverage and track trips per vehicle-hour.
- P1 — Test: run an airport-positioning pilot near JFK with a matched comparison period. Measure airport trips, fare per vehicle-hour, deadhead time, and cancellations.
- P2 — Investigate: add driver supply, vehicle availability, and route-level traffic data before claiming a capacity cause.
Repeat the result using 30-minute peak windows and excluding extreme-duration trips. The data is a January snapshot, so seasonality remains a material uncertainty.
Supporting technical detail
The source is the NYC TLC Trip Record Data. The case uses the January 2025 yellow taxi Parquet file and the official taxi-zone lookup. The TLC notes that records come from technology-provider submissions and may not be fully accurate or complete. This analysis describes observed trip patterns; it does not measure wait time, driver supply, traffic speed, or profit.
Data dictionary: Read the TLC trip record documentation