Online Retail: Finding the Customers Behind Repeat Revenue
In brief
A transaction analysis showing where repeat revenue comes from and which markets deserve closer growth attention.
Executive summary
Business problem: grow repeat revenue without increasing dependence on one-off orders or a small customer group. Key findings: the cleaned data contains 4,338 identifiable customers; the top 10% generate 61.4% of revenue; and the UK contributes about 82% of revenue. Decision implication: retention is valuable but concentrated. Recommended action: protect high-value customers and treat nearby European markets as research priorities before any expansion decision.
Evidence strength: Medium for historical revenue and repeat-order patterns; low for market attractiveness, profitability, and causal retention effects.
Business context
This UK online retailer sold gift products to customers in the UK and overseas. The transaction file contains more than half a million rows, but raw sales volume alone does not show whether growth comes from loyal customers, one-off orders, or a small group of high-value buyers.
That distinction matters. A business that relies heavily on a few customers needs a different growth plan from one with a broad base of repeat buyers.
Business question
Which customers and markets should the retailer prioritize to grow repeat revenue without relying only on more one-time orders?
Role
Role: transaction cleaning, order and customer aggregation, concentration analysis, market comparison, scenario math, and holdout recommendation. No retention campaign execution or post-test customer value is included.
Data used
Completed purchases are separated from cancellations and invalid quantities or prices. Line items are grouped into orders, and orders into customers. This makes it possible to compare revenue, order frequency, repeat behavior, and country mix using business-level measures instead of raw transaction rows.
Why it matters
Revenue growth is more resilient when customers return and no single market or customer group carries all the risk. That makes concentration and repeat purchase useful management questions, not just reporting metrics.
Approach
Cancellations and invalid values are removed, line items are grouped into orders, and orders are grouped into customers. The result describes revenue and repeat behavior; it does not measure margin or prove that a retention offer will work.
Key findings
Finding 1: Revenue was concentrated among a small customer group
The cleaned data contains 4,338 identifiable customers, 18,532 orders, and £8.91 million in recorded revenue. Customers with at least two orders made up 65.6% of the customer base.
The highest-value 10% of customers generated 61.4% of revenue. This is a concentration risk and an opportunity: keeping a small group of valuable customers engaged could protect a large share of sales, while losing them would have an outsized effect.
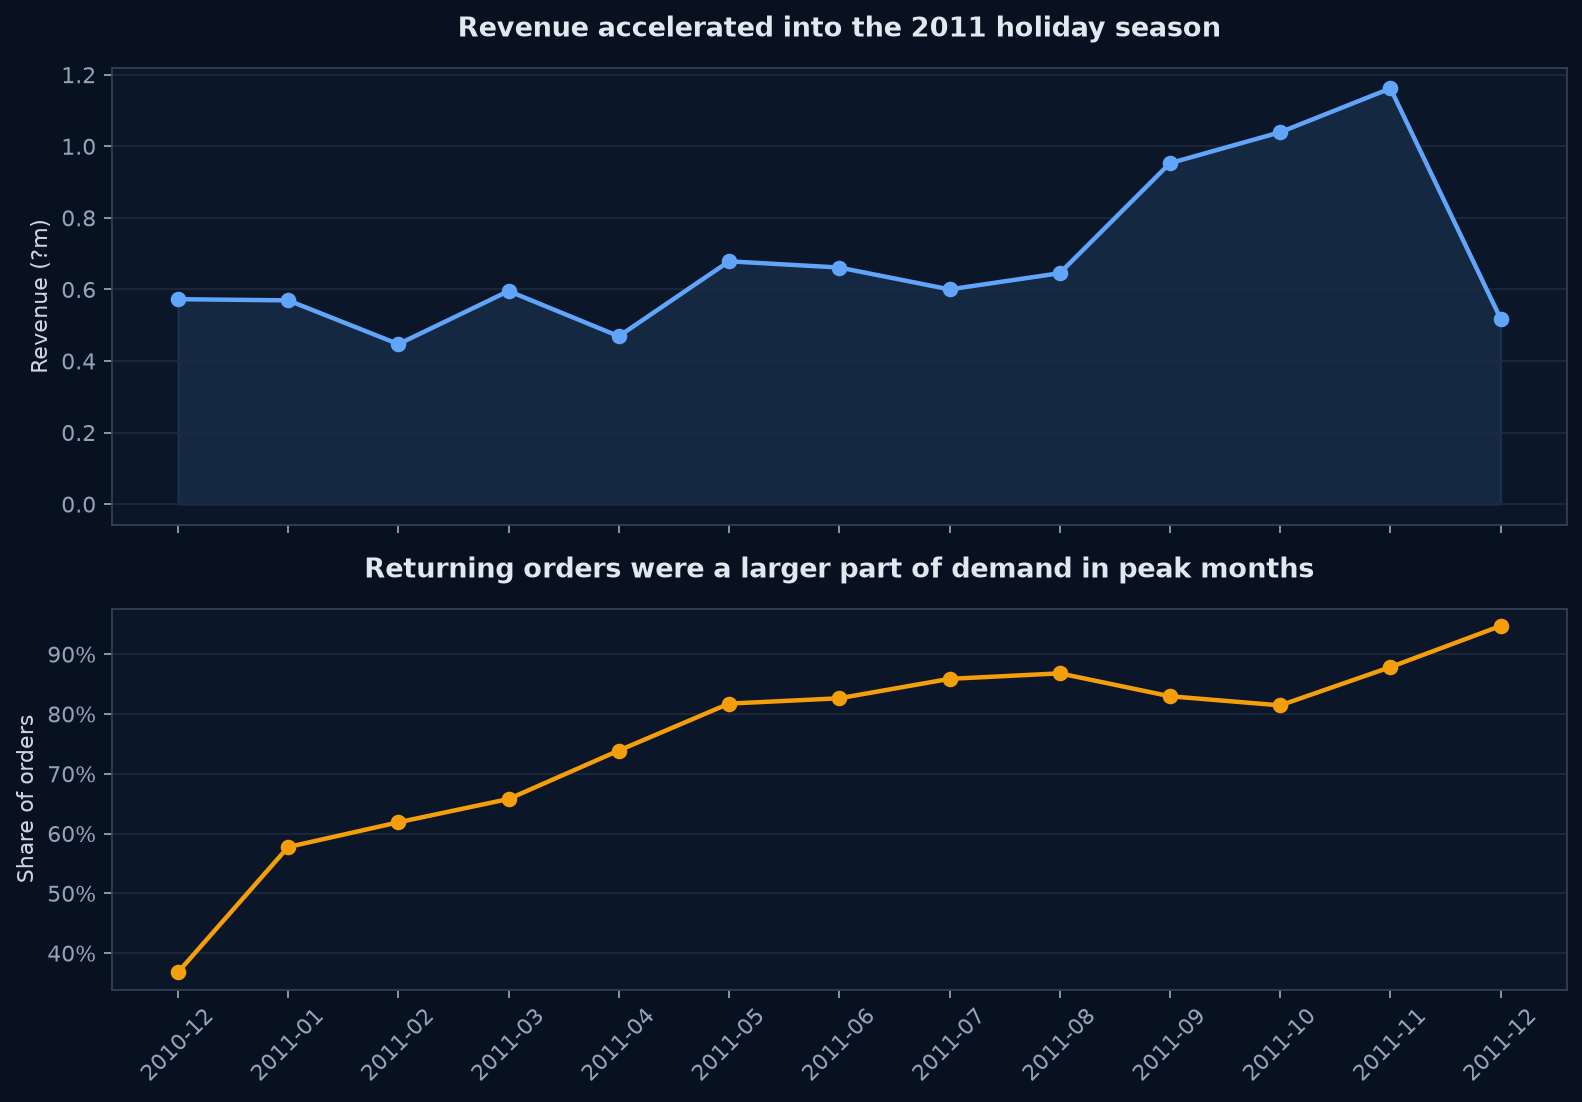 Chart takeaway: Cleaned UCI Online Retail orders, December 2010–December 2011: Recorded revenue rose into the holiday season while returning orders became a larger share of orders
Finding 2: The UK was the core market, but nearby countries added visible opportunity
The UK generated £7.31 million, or about 82% of cleaned revenue. The next markets were the Netherlands, Ireland, Germany, and France. These markets were much smaller than the UK, but their historical revenue is only a reason to validate them, not proof of market attractiveness.
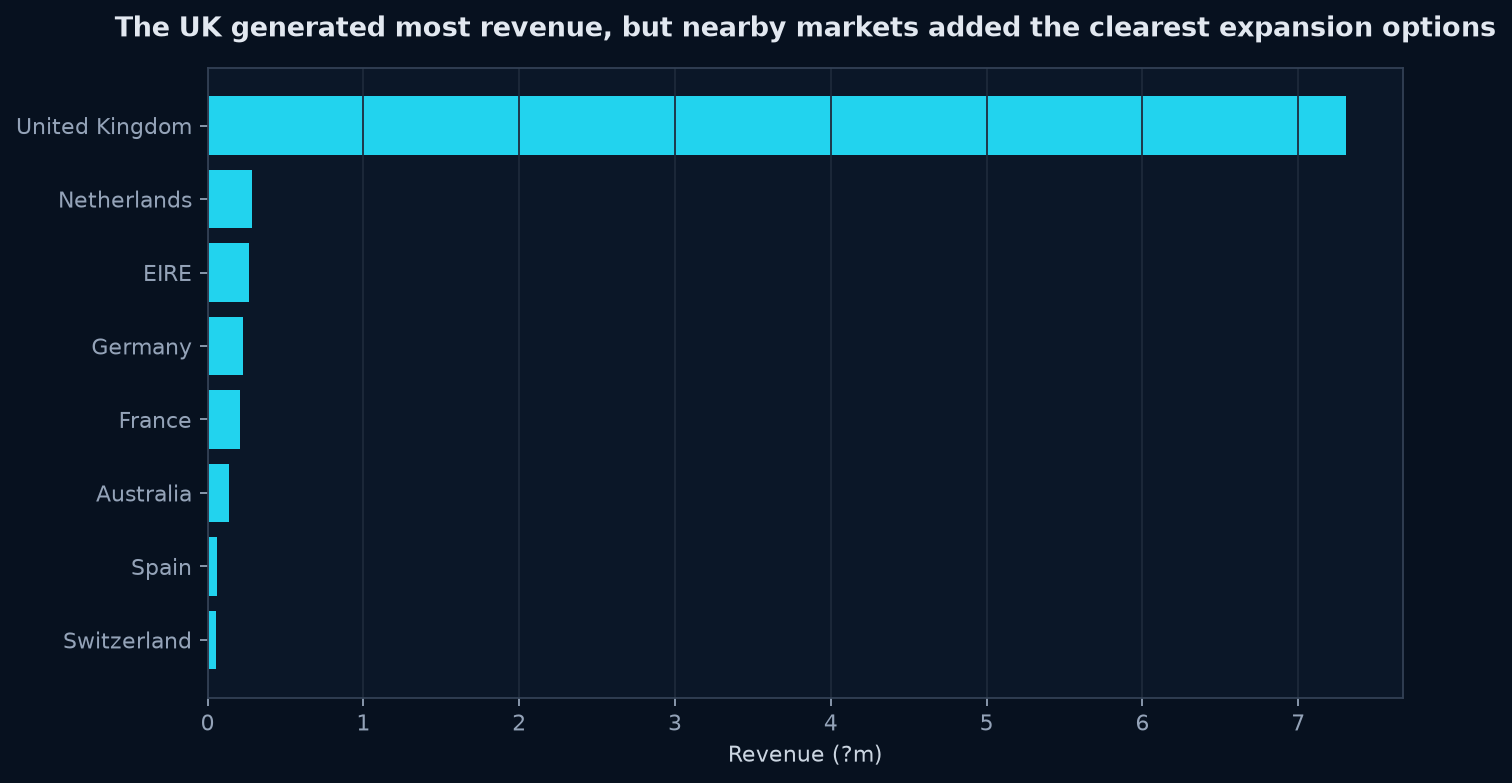 Chart takeaway: Cleaned UCI Online Retail revenue, December 2010–December 2011: The UK generated most revenue, while nearby European markets require validation before expansion
Finding 3: Growth became more dependent on returning orders as the period progressed
Returning orders became a much larger part of monthly orders as the customer base matured. Revenue also rose sharply in September, October, and November 2011, with November reaching £1.16 million. December is only partially covered in the source data, so it should not be compared with a complete holiday month.
Business meaning: The retailer appears to have a useful repeat-purchase pattern, but the value is unevenly distributed. Growth planning should protect the highest-value customer relationships while testing whether successful UK offers can travel to nearby markets; the data does not establish market attractiveness.
Visual evidence
Decision: customer identity is the first retention denominator
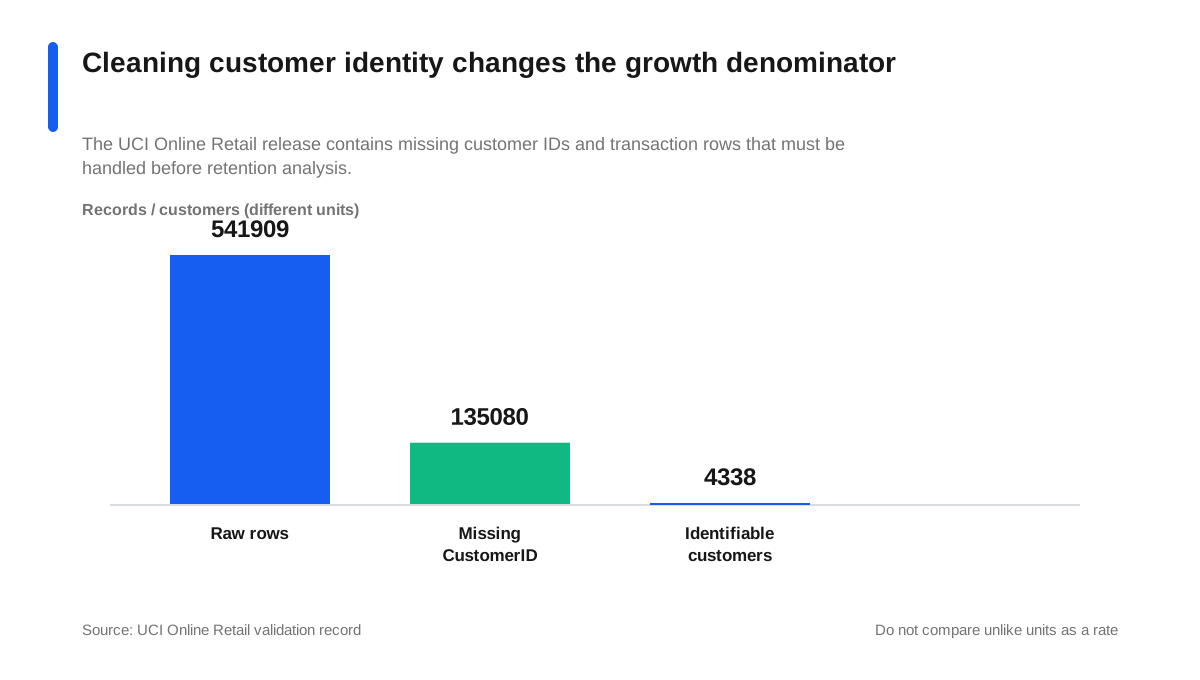 Chart takeaway: UCI Online Retail cleaning funnel: 541,909 raw transaction rows, 135,080 missing CustomerID values, and 4,338 identifiable customers
The visual shows why repeat-revenue claims must state the identifiable-customer boundary.
Recommendation
- Create a high-value customer retention plan. Track the top customer group separately and test early access, relevant bundles, or service improvements. The data shows where the value is concentrated, but it does not prove which offer will change behavior.
- Research country-specific growth conditions. Use the Netherlands, Ireland, Germany, and France as a research shortlist—not expansion evidence. Compare reachable demand, repeat order rate, market size, CAC, shipping cost, competition, regulation, and product mix before designing a controlled growth test.
- Measure returning orders as a core growth metric. Report new customers, returning customers, orders, and revenue together so higher sales are not mistaken for healthier customer relationships.
- Improve cancellation and customer identification fields. The raw file contains 9,288 cancellation rows and 135,080 rows without a customer ID. Better capture would make retention reporting more complete.
Decision status: Completed historical analysis; retention tests and market investment remain proposed and unmeasured.
What internal data would improve the decision
Customer identity coverage, product margin, shipping cost, marketing exposure, inventory, and repeat-purchase history would turn the revenue signals into a contribution-based retention and expansion decision.
Read technical details
Technical appendix
The source is the UCI Online Retail dataset, licensed CC BY 4.0. The raw file covers 2010-12-01 through 2011-12-09. The cleaned analysis removed cancelled invoices, non-positive quantities, non-positive prices, and rows without CustomerID. Revenue is Quantity * UnitPrice; cost, margin, shipping cost, and marketing spend are not available, so this case study discusses revenue opportunity rather than profit. Published metrics are pinned to the locally validated workbook snapshot (retrieved 20 August 2026; SHA-256 begins 43465a06f2cc). The validation script stops with a source-drift error if that snapshot changes.
Validation resources: Run the supporting-case validation workflow · View metric validation and chart code · View the UCI dataset