Online Shopping Clickstream: Finding the First Product Friction
In brief
A product decision study that separates browsing volume from journey progress and defines the instrumentation needed before a conversion experiment.
Executive summary
Business problem: the store needs to improve shopping progress, not simply page traffic.
Key findings: the median session has four events; 79.0% continue beyond the first event; stage volume falls sharply from 93,452 to 2,823; and the file cannot prove completed purchases.
Business impact: the largest immediate risk is making a conversion decision without reliable session-to-order measurement.
Recommended action: instrument the journey first, then test the largest observed transition with a holdout group.
Decision frame and KPI tree
Decision owner: Product Manager. Decision: which journey transition should receive the next product experiment? North-star KPI: completed purchase rate. Drivers: stage progression, product interaction, and checkout completion. Guardrails: page speed, error rate, average order value, and customer complaints.
The current file supports stage events, not a trustworthy completed-purchase KPI. That definition gap is itself a senior finding.
Evidence and root-cause view
The event counts are 93,452 → 41,037 → 19,301 → 8,861 → 2,823 across page stages. This establishes where activity thins out, but not why. Possible explanations include weaker content, navigation friction, product availability, or tracking loss. The data cannot distinguish them.
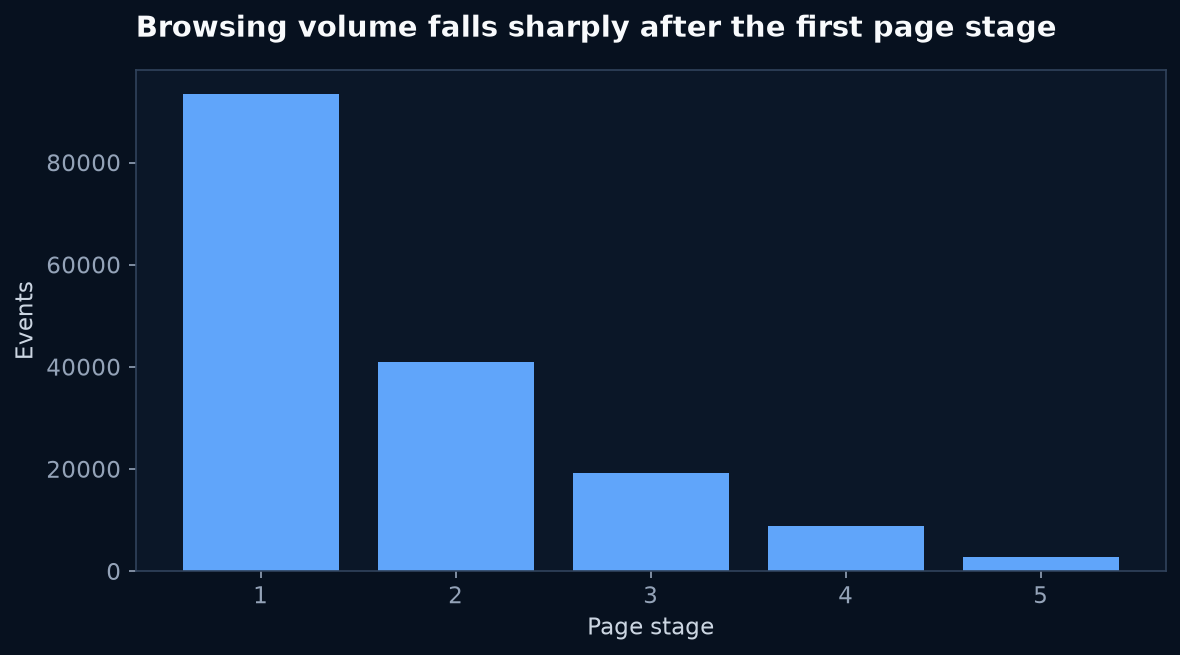 Chart takeaway: UCI online-shopping clickstream, five-month 2008 sample: Event volume fell from 93,452 at stage 1 to 2,823 at stage 5
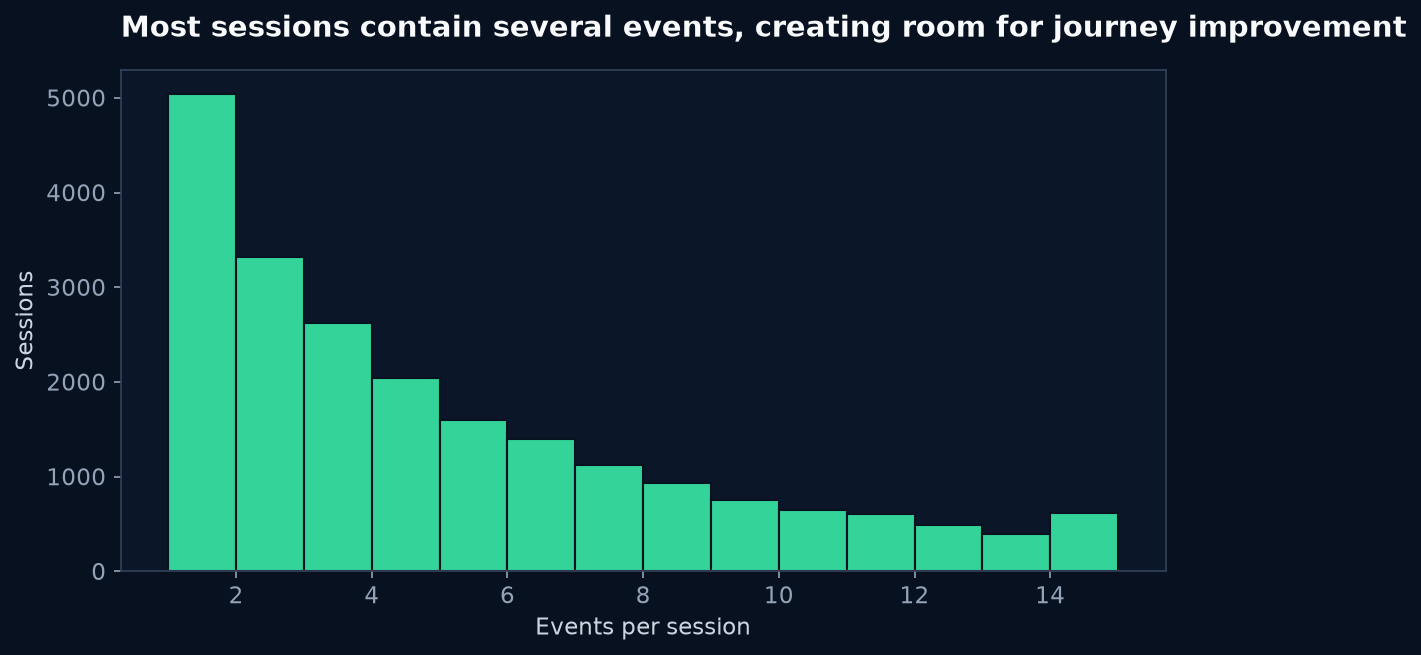 Chart takeaway: UCI online-shopping clickstream, 24,026 sessions: 79.0% of sessions contained more than one event
The source has 165,474 rows, 14 fields, no missing values, and no duplicate rows. The unit is an event, not a customer or order. Country and product-model fields also require session-level aggregation to avoid overstating value.
Decision and opportunity scenarios
Do not attach revenue to the stage counts until order linkage is fixed. The conservative opportunity is measurement coverage: define one session ID, one checkout event, and one confirmed order ID. The expected case is a controlled experiment on the first high-volume transition; the ambitious case adds product availability and search-result data to explain the drop.
Prioritized plan
- P0 — Act now: add a funnel-quality dashboard and reconcile event counts with confirmed orders.
- P1 — Test: improve the first high-volume transition for a randomly selected treatment group.
- P2 — Investigate: compare the transition by country, category, and product model.
Experiment: target multi-page sessions; treatment changes one journey element; control keeps the current experience; primary metric is completed purchase rate; guardrails are order value, page errors, and return rate. Success requires a stable lift across countries and a sensitivity check excluding sessions with incomplete event coverage.
Takeaway
The first business decision is not “which page converts best?” It is whether the measurement is reliable enough to support a product experiment. Once that is fixed, the sharp stage drop gives the team a defensible place to start.
Supporting detail
Source: UCI Clickstream Data for Online Shopping, CC BY 4.0. The file covers five months in 2008 and does not provide confirmed revenue, margin, customer identity, or experiment assignment.