Airfare Pricing: Making Revenue Decisions With the Right Benchmark
In brief
A commercial decision framework that separates nominal fare movement from inflation and shows what additional evidence is needed before changing route prices.
Executive summary
Business problem: interpret fare movement before changing prices or discount rules.
Key findings: current-dollar and constant-dollar fares answer different questions; the national average is a benchmark, not a route diagnosis; and demand, margin, and booking-window data are required for a commercial decision.
Business impact: the main risk is overreacting to a nominal price movement that does not represent real pricing power.
Recommended action: use the BTS series as a guardrail, then validate a route-level test with ticket and demand data.
Decision frame and KPI tree
Decision owner: Commercial Director. Decision: where should price or discount policy change? North-star KPI: contribution per available seat. Drivers: fare, passengers, load factor, route mix, and variable cost. Guardrails: conversion, cancellation, customer complaints, and competitor fare position.
Baseline and diagnostic logic
The BTS national fare series publishes current-dollar and inflation-adjusted fare measures, with annual history from 1995 and quarterly releases. Current dollars describe what passengers paid; constant dollars provide a more comparable purchasing-power view.
The national series cannot explain a route-level change. It combines carriers, markets, itinerary lengths, and fare types. A shift in the average may therefore be mix, not a price decision.
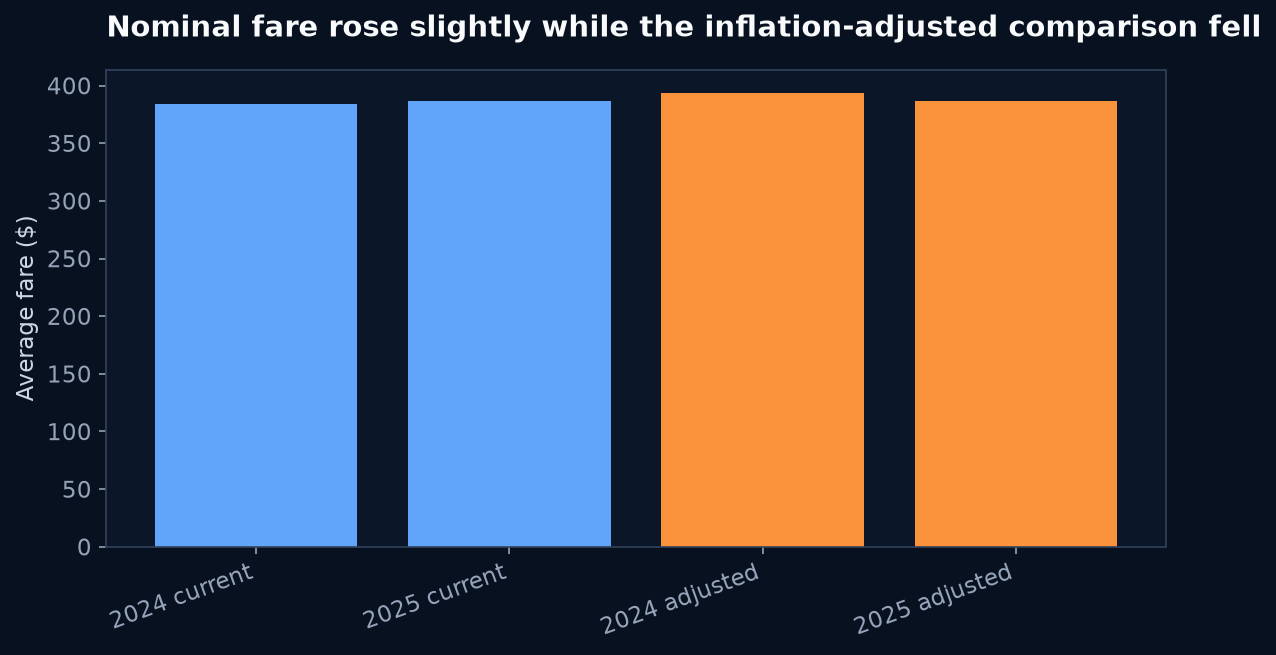 Chart takeaway: BTS national average domestic fare, 2024 versus 2025: Nominal fare rose slightly while the inflation-adjusted comparison fell
Driver decomposition and scenario analysis
For a route, revenue should be decomposed as passengers × average fare and contribution as revenue minus variable cost. The conservative scenario is a fare change with no volume response; the expected scenario uses observed route elasticity; the ambitious scenario includes mix improvement. None should be published as a forecast until route-level demand and cost are available.
The important trade-off is clear: higher fare can improve revenue per passenger but reduce passenger volume. A price decision that improves revenue but lowers contribution or load factor is not a success.
Prioritized plan and measurement
- P0 — Act now: add the BTS current/constant-dollar benchmark to commercial reviews.
- P1 — Test: run a controlled price or discount change on comparable routes and booking windows.
- P2 — Investigate: join BTS Origin and Destination Survey data with internal bookings, costs, and competitor fares.
Primary metric is contribution per seat; guardrails are bookings, load factor, cancellation, and complaint rate. Repeat by route, season, cabin, and booking window. If the conclusion changes when incomplete quarters or mix-shifted routes are excluded, treat it as weak evidence.
Takeaway
The senior pricing decision is not “did fares rise?” It is whether the business can separate price, inflation, and mix well enough to act without trading away demand or contribution.
Supporting detail
Source: Bureau of Transportation Statistics. The national data does not contain airline margin, route-level elasticity, promotional cost, or customer-level willingness to pay.