Company Performance: Explaining Growth Before Calling It Healthy
In brief
A public-filing analysis that separates reported growth from profitability and turns divergence into management questions.
Executive summary
Business problem: determine whether reported growth is also improving profitability.
Key findings: Microsoft’s reported revenue increased about 32.9% from FY2023 to FY2025; net income increased about 40.7%; and net margin improved from approximately 34.1% to 36.1%.
Business impact: the observed result is healthy at the reported-company level, but it does not identify whether growth came from volume, price, mix, acquisitions, or cost control.
Recommended action: use the margin improvement as a starting point for segment and cost-driver review, not as proof that every business line improved.
Decision frame and KPI tree
Decision owner: Finance Leader. Decision: where should management invest, control cost, or investigate performance quality? North-star KPI: sustainable operating contribution. Drivers: revenue growth, gross margin, operating expense, tax, mix, and recurring demand. Guardrails: cash flow, customer concentration, and one-off items.
Baseline and driver analysis
The SEC Company Facts API provides structured filing facts, periods, forms, and filing dates. The Microsoft comparison uses reported annual revenue and net income facts. Revenue rose from $211.9B to $281.7B, while net income rose from $72.4B to $101.8B. The margin movement is directionally positive, but net income is not the same as operating contribution.
This is evidence of reported improvement, not causal proof. Fiscal periods, amended filings, accounting tags, and restatements must remain visible. The next diagnostic layer is segment revenue, gross margin, operating expense, and cash conversion.
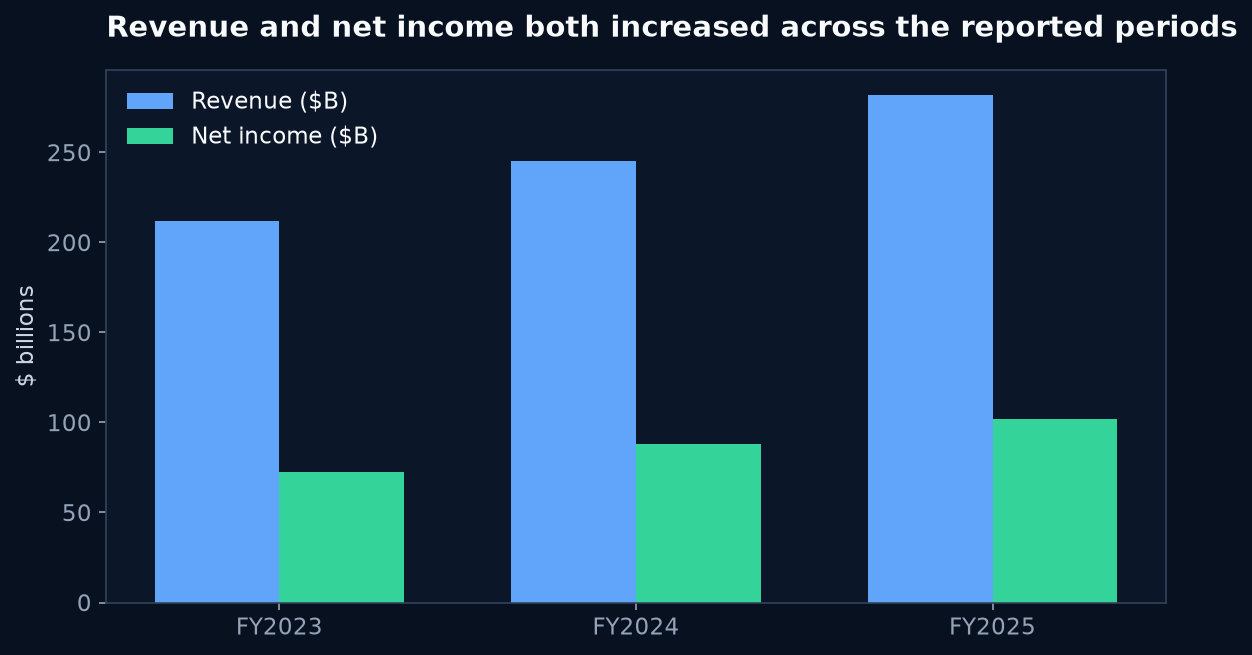 Chart takeaway: Microsoft reported results, FY2023–FY2025: Revenue rose from $211.9B to $281.7B while net income rose from $72.4B to $101.8B
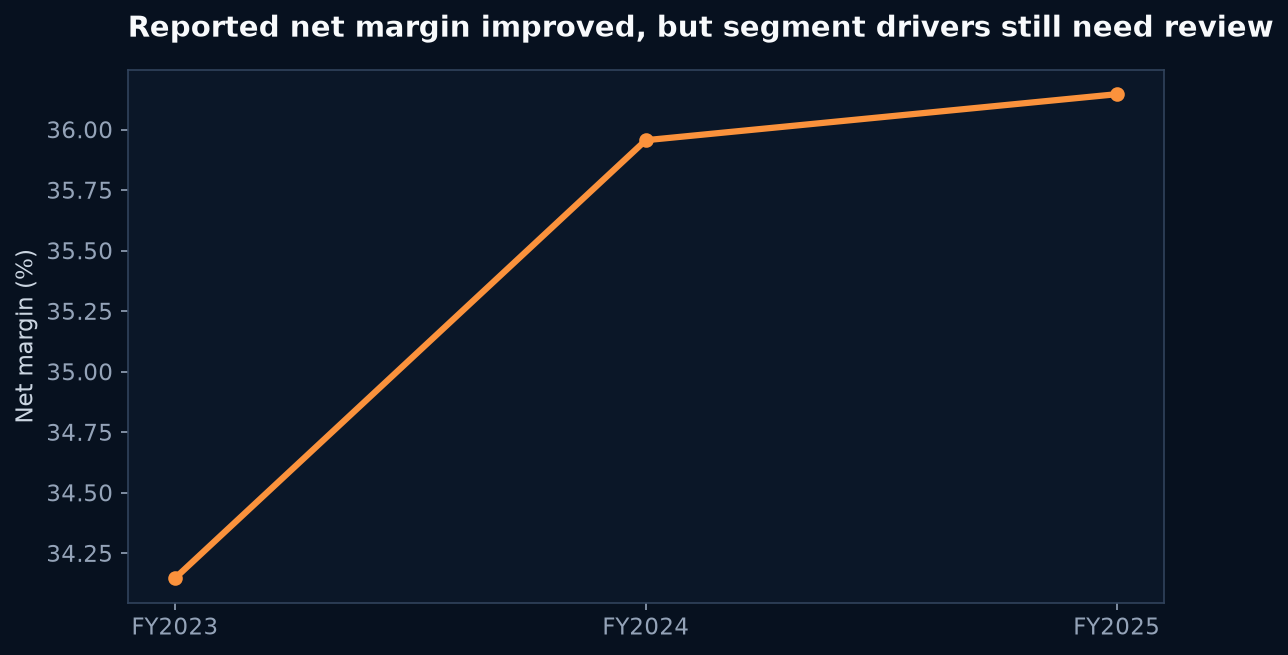 Chart takeaway: Microsoft reported results, FY2023–FY2025: Net margin improved from about 34.1% to 36.1%, but segment drivers still need review
Opportunity, trade-offs, and scenarios
The conservative case is to preserve the FY2025 margin while growth slows; the expected case tests whether the current margin can hold as mix changes; the ambitious case identifies controllable cost or mix drivers that improve contribution without reducing product investment. No incremental profit is claimed because segment costs and intervention effects are not established.
Prioritized plan and measurement
- P0 — Act now: monitor revenue growth, net margin, operating expense, and cash flow together.
- P1 — Test: investigate one segment or cost category where growth and margin direction diverge.
- P2 — Investigate: reconcile SEC facts to the filing statements and notes when tags or periods change.
Success means durable contribution and cash conversion, not one strong annual ratio. Repeat the analysis using filing date, fiscal period, amended filings, and alternative revenue tags as sensitivity checks.
Takeaway
Senior financial analysis turns growth into a question about quality and durability. SEC data makes the baseline repeatable; the filing context explains what management can actually control.
Supporting detail
Source: SEC Company Facts. Values come from public XBRL filings and can reflect restatements, taxonomy changes, and different fiscal calendars. This is not stock-price analysis or investment advice.