New York Short-Term Rentals: Finding Marketplace Concentration
In brief
A supply-side marketplace analysis that separates listing growth from marketplace health and identifies where concentration creates risk.
Executive summary
Business problem: protect marketplace choice and resilience while balancing hosts and guests.
Key findings: supply is dominated by entire homes and private rooms; 24.7% of listings are controlled by the top 1% of observed hosts; 8,758 listings have missing prices; and listings are not bookings.
Business impact: platform policy can have an outsized effect if professional hosts control a large share of visible supply, but demand and revenue cannot be inferred from listings alone.
Recommended action: monitor concentration and availability, then add booking data before changing marketplace investment.
Decision frame and KPI tree
Decision owner: Marketplace GM. Decision: where should the platform invest in supply, trust, or demand? North-star KPI: successful booked nights with acceptable guest experience. Drivers: active supply, availability, price, demand, host quality, and location. Guardrails: cancellations, complaints, regulatory risk, and host concentration.
Baseline, segmentation, and driver analysis
The validated snapshot contains 30,555 listings, 19 columns, and no duplicate rows. It includes 16,808 entire-home and 13,009 private-room listings. After restricting price to $20–$1,000, 21,138 listings remained and the median listed price was $171.
The top 1% of observed hosts account for 24.7% of listings. This is a concentration risk, not proof that these hosts create most bookings. Missing price and license values also require separate treatment; missing license is not evidence of non-compliance.
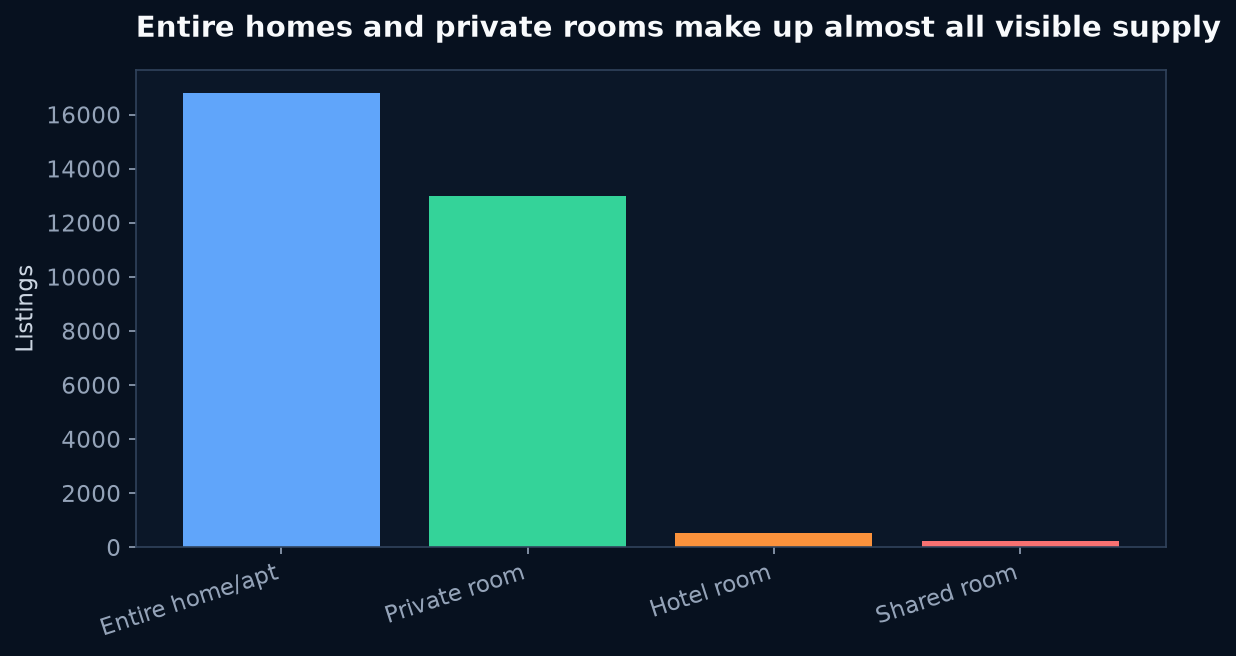 Chart takeaway: Inside Airbnb New York snapshot, June 14 2026: Entire homes and private rooms made up almost all of 30,555 visible listings
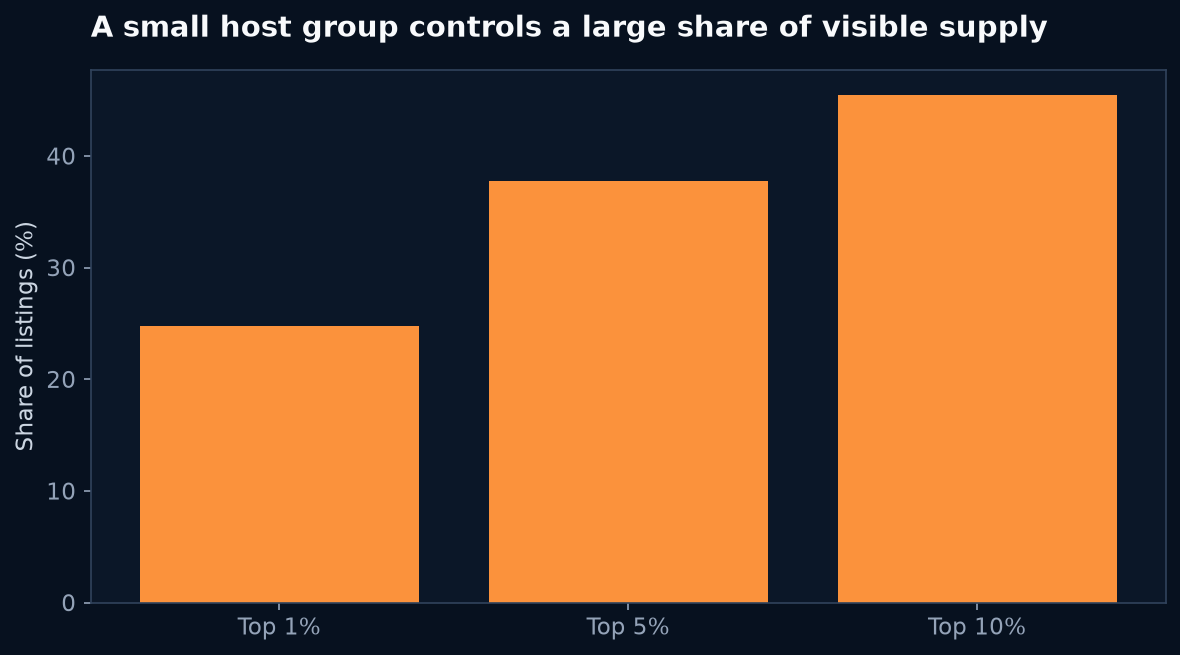 Chart takeaway: Inside Airbnb New York snapshot, June 14 2026: The top 1% of observed hosts controlled 24.7% of visible listings
Opportunity, trade-offs, and scenarios
The conservative opportunity is to reduce supply concentration risk without removing productive hosts: improve onboarding and visibility for smaller hosts. The expected case adds booking and occupancy data by neighbourhood and room type. The ambitious case tests targeted supply incentives. The trade-off is that incentives can add supply but reduce platform contribution or increase regulatory exposure.
Prioritized plan and measurement
- P0 — Act now: add host concentration, active availability, price coverage, and cancellation to the marketplace scorecard.
- P1 — Test: run a smaller-host activation experiment in a high-demand, low-choice segment.
- P2 — Investigate: join bookings, reviews, response time, and regulatory status before claiming customer or revenue impact.
Primary metric is booked nights per active listing; guardrails are cancellation, complaints, guest rating, host retention, and contribution. Repeat concentration using top 0.5%, 1%, and 5% definitions.
Takeaway
Marketplace health is not listing count. It is reliable choice, demand conversion, and resilient supply. The current data identifies concentration clearly and shows exactly which missing measures must be added before making a commercial decision.
Supporting detail
Source: Inside Airbnb, New York snapshot dated 14 June 2026, CC BY 4.0. The source describes public listing data and warns that accuracy is not guaranteed. No bookings, occupancy, revenue, or causal policy effect is available.