Campaign Incrementality: Did Advertising Create New Customers?
In brief
A randomized advertising analysis that separates additional conversions from customers who would have converted anyway.
Executive Summary
- Decision: scale only when incremental CPA is below internal contribution value.
- Evidence: treatment conversion was 0.309% versus 0.194% for control.
- Benchmark lift: 115 additional conversions per 100,000 assigned users in the released sample.
- Uncertainty: the 95% interval was 0.108–0.122 percentage points; p < 0.001.
- Limit: public data has no spend, margin, or customer value, so profitability is not proven.
Business Problem
The growth team needs to know whether paid advertising creates additional customers. Reported conversions alone are not enough because some customers would have converted without seeing the campaign.
Dataset and Measurement
The Criteo AI Lab uplift dataset is built from randomized incrementality tests. The validated unbiased release contains 13,979,592 user rows, 12 anonymized features, assignment, exposure, visits, and conversions. The unit is one user row. The primary metric is conversion by assignment, with visit rate as a supporting metric.
Analysis
I used intention-to-treat: every assigned user stays in their original treatment or control group. This preserves the benefit of randomization. Exposure is reported descriptively because it occurs after assignment and appears only for treated users.
The treatment group converted at 0.309% and the control group at 0.194%. The absolute difference was 0.115 percentage points (95% CI 0.108–0.122pp). The relative lift was approximately 59% within the released benchmark, but the absolute difference is easier to interpret. Visits increased by 1.034 percentage points (95% CI 1.006–1.063pp). Criteo warns that this assembled, non-uniformly subsampled benchmark should not be treated as a current campaign forecast.
An exploratory split of the full anonymized feature f0 distribution found the largest conversion difference in its second quartile: 0.386pp (95% CI 0.361–0.410pp). The other quartiles were 0.038pp, 0.019pp, and 0.010pp. Because f0 has no business meaning and the split was not a pre-registered audience definition, this is a heterogeneity signal to retest, not a targeting recommendation.
| Exploratory band | Absolute lift | 95% CI | Decision |
|---|---|---|---|
f0 lowest quartile | +0.038pp | +0.027 to +0.049pp | No targeting decision yet |
f0 second quartile | +0.386pp | +0.361 to +0.410pp | Retest in a holdout |
f0 third quartile | +0.019pp | +0.012 to +0.027pp | No targeting decision yet |
f0 highest quartile | +0.010pp | +0.005 to +0.016pp | No targeting decision yet |
Economics are not estimable from this benchmark because spend, margin, and conversion value are absent.
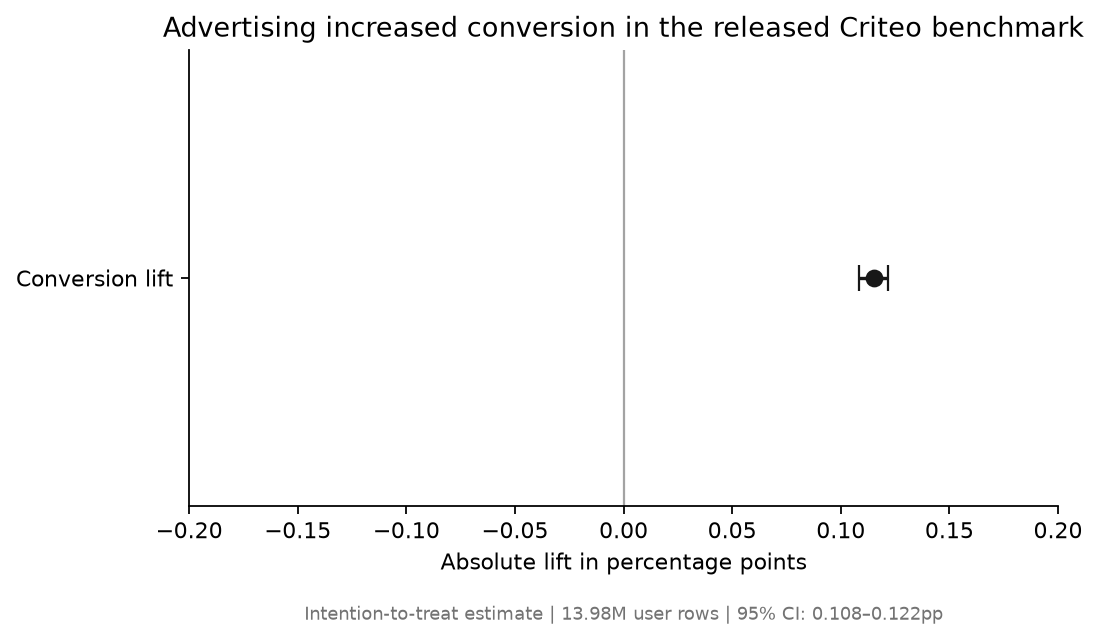 Chart takeaway: Criteo randomized campaign benchmark: assigned treatment increased conversion from 0.194% to 0.309%, with the uncertainty shown in the accompanying result
Business Interpretation
The released benchmark shows a clear assignment-rate contrast. That is evidence about this benchmark population, not proof of the same lift in a current campaign. Statistical significance is not the same as commercial success: a very large sample can make a small effect look certain, while profitability still depends on spend and contribution.
The practical planning question is whether the current campaign's internally measured incremental conversions create more contribution than the campaign costs. Neither current incremental conversions nor campaign economics can be calculated from this public file.
Decision and Next Experiment
P0: do not use this benchmark as a rollout forecast. P1: retest high-response feature bands in a current-campaign holdout, with multiple-testing control and an incremental CPA guardrail. P2: add internal spend, margin, retention, and complaint outcomes.
The next test should pre-register the primary conversion metric, visit-quality guardrails, sample size, minimum detectable effect, and stopping rule. Do not replace assignment with exposed-only comparisons.
Risks and Limitations
This is a public benchmark assembled from several experiments. Features are anonymized, and the file has no campaign cost, conversion value, margin, or downstream retention. Segment effects are exploratory until they replicate.
Interview explanation
30-second explanation: “I evaluated Criteo’s randomized incrementality benchmark with an intention-to-treat comparison. The released sample shows a 0.115 percentage-point conversion difference, with a tight confidence interval. I would not transport that rate to a current campaign or call it profitable without cost and contribution data. I would use a current-campaign holdout, incremental CPA guardrail, and a fresh test for segment targeting.”
2-minute explanation: I would then explain randomization, denominator choice, confidence intervals, practical significance, why exposure is post-treatment, and the economic guardrails needed to conclude the campaign test.
Supporting detail
The reproducible analysis lives under projects/growth-analytics/01-campaign-incrementality. Raw data is not published in this portfolio.