Marketplace Supply and Demand: What Can the Public Data Tell Us?
In brief
A limited-data marketplace diagnosis that separates recorded trips from the requests and driver hours needed to measure imbalance.
Executive Summary
- Decision: where and when should a driver incentive be tested?
- Observed signal: recorded trips peak at 18:00 and are much lower at 04:00.
- Important limit: the source does not contain all requests, cancellations, wait, or online driver-hours.
- Recommendation: instrument missing denominators, then run a zone-window switchback experiment.
- Decision metric: request fulfillment rate, with incremental fulfilled trips per incentive dollar as the economic test.
Business Problem
Trip volume is not the same as demand. A low-trip zone may have little demand or poor supply. A high-trip zone may be healthy or may be losing many requests. The first decision is to identify which explanation the data can support.
Dataset
The source is the official NYC TLC HVFHV trip data. Each record is one submitted dispatched trip. The bounded API slice covers 1–7 February 2019 and contains 4,965,012 rows with provider/license group, pickup/drop-off timestamps, and pickup/drop-off zones; optional fields are not assumed to be complete. It does not include requests, rejected matches, cancellations, wait time, or driver-online hours.
Analysis
Hourly recorded trips ranged from 59,285 at 04:00 to 334,713 at 18:00 across 4,965,012 rows. This is useful for staffing and sampling a peak window. It is not sufficient to claim a shortage, because recorded trips can fall when demand is low and can stay high even when many requests are lost.
Business Interpretation
The strongest evidence is temporal concentration, not causal imbalance. The next data requirement is a request-to-outcome funnel joined to driver availability at the same zone and time grain. Recorded trips per online driver-hour is a supply diagnostic, while request fulfillment is the customer outcome. Incremental trips per incentive dollar is the economic test, with adjacent-zone displacement as a guardrail.
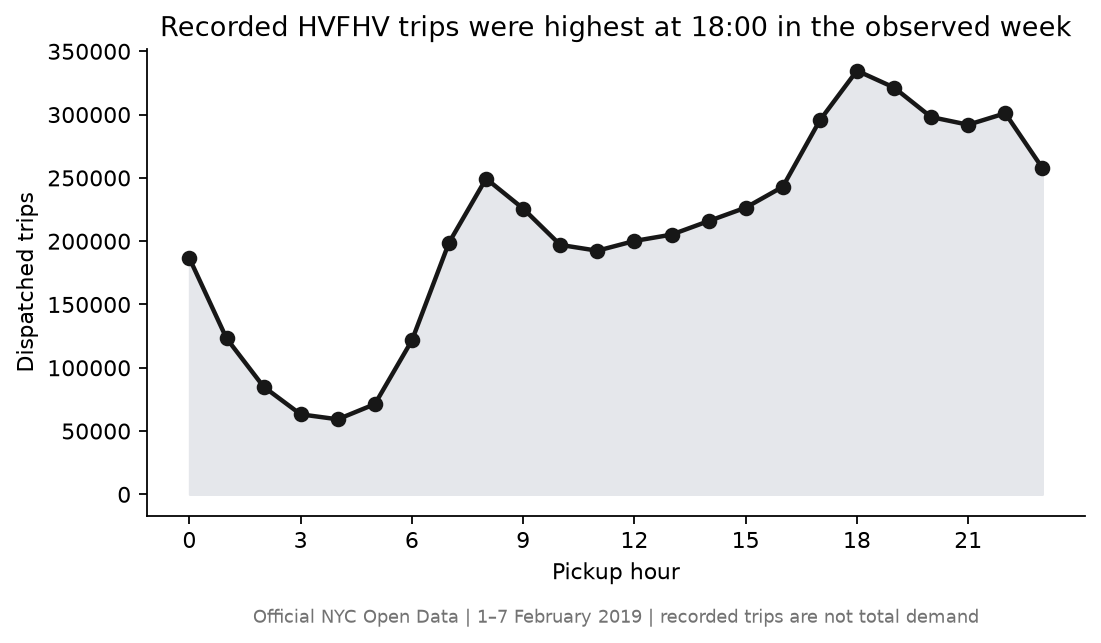 Chart takeaway: Official NYC HVFHV Open Data slice: recorded trips peaked at 18:00, but the public file does not show unserved requests
TLC's monthly High Volume FHV report provides an additional observed-supply proxy. Average reported trips per day rose from 654,410 in 2024 to 667,537 in 2025, while average unique drivers stayed almost flat at 83,399 versus 83,299. This is useful triangulation, not proof that drivers were online when demand was highest.
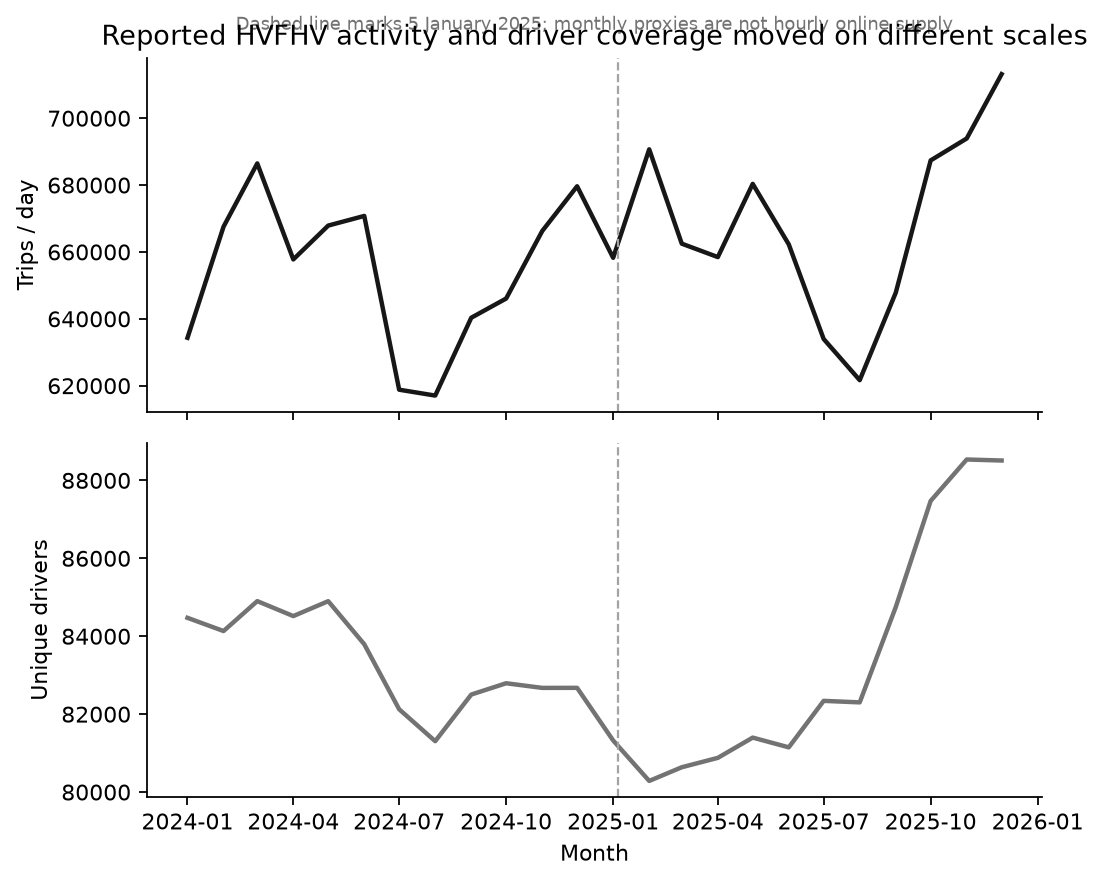 Chart takeaway: TLC monthly High Volume FHV reports: reported trips rose in 2025 while average unique drivers stayed broadly flat
Decision and Experiment
Do not start with a citywide subsidy. Run a pre-powered zone-window switchback: selected shortage windows receive an incentive for eligible drivers, while matched windows remain business as usual. Use request fulfillment as the primary metric, with recorded trips per online driver-hour as a supply diagnostic. Watch estimated wait, cancellations, driver earnings, incentive cost per incremental ride, and neighboring-zone trips.
Risks and Limitations
The source is historical, bounded to one week, and based on submitted dispatched trips. It cannot identify total demand, driver supply, profit, or customer experience. Driver-level randomization may suffer interference because drivers and riders share the same marketplace.
Interview explanation
30-second explanation: “I found a clear peak in recorded HVFHV trips, but I did not overstate it as unmet demand. I would first add request, cancellation, wait, and online driver-hour data, then test a targeted incentive using zone-window randomization. The decision metric is request fulfillment, with incremental trips per incentive dollar as the economic guardrail.”
2-minute explanation: I would explain the public-data grain, the missing denominator problem, the difference between recorded trips and total demand, the switchback design, interference, and the required guardrails.