Congestion Pricing: When the Causal Design Fails the Test
In brief
An event-study audit of NYC bridge and tunnel traffic that shows why a plausible policy story is not enough for a causal business decision.
Executive Summary
- Decision: should mobility leadership attribute a traffic change to congestion pricing?
- Data: 27,080 daily car-count observations across 10 MTA bridge and tunnel facilities from 2019 to May 2026.
- Design: weekly event study comparing three CBD-access facilities with seven comparison facilities.
- Finding: treated and comparison facilities were already moving differently before 5 January 2025.
- Decision: do not publish a causal effect or change policy from this design; improve the control strategy first.
Business Problem
A mobility marketplace may change pricing, supply, or geographic strategy after a city policy. A simple before-and-after chart is risky because traffic also responds to seasonality, work patterns, weather, construction, and facility-specific changes.
Dataset and Treatment
The source is the official MTA Bridges and Tunnels Hourly Crossings dataset. I queried car-class counts and aggregated them to one facility-week. The treatment facilities are RFK Bridge Manhattan, Queens-Midtown Tunnel, and Hugh L. Carey Tunnel. The comparison facilities are the remaining seven MTA facilities in the panel.
This is a traffic-policy outcome, not a ride-hailing outcome. It helps test the econometric reasoning a marketplace analyst needs, but it does not measure riders, requests, driver supply, or platform revenue.
Metric Framework
Traffic-policy outcome
  -> weekly car crossings
    -> facility, week, direction, vehicle class
  Diagnostics: pre-trends, event timing, facility mix, spillover
  Guardrails: neighboring crossings, transit, weather, facility disruptions
Method
The event study estimates the treated-minus-control difference by week relative to 5 January 2025, with facility and calendar-week structure and HAC uncertainty on the weekly difference. Week -1 is the reference period. The analysis also runs placebo dates before the policy.
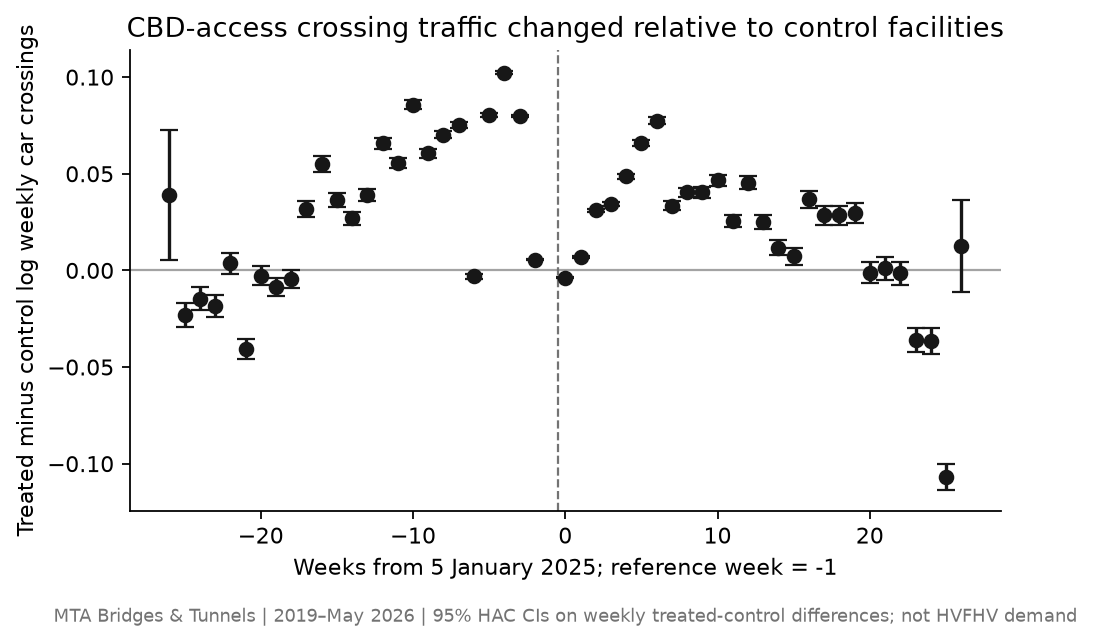 Chart takeaway: MTA bridge and tunnel event study: pre-policy treated-control differences show that the parallel-trends assumption is not credible
Key Finding: The design fails before the policy date
The treated facilities were not following the same path as the comparison facilities before the policy. The treated-minus-control difference was approximately +10.2% in event week -4 and +8.0% in event week -3 relative to the reference week. The pre-policy movement is too large and systematic to treat the post-policy coefficients as a clean policy effect.
This is not a failed analysis. It is the most important result for the decision: the chosen control group does not provide a credible counterfactual.
Business Interpretation
The post-policy series may still contain a real change, but this design cannot tell whether congestion pricing caused it. A city manager should not change rider pricing or driver incentives based on a coefficient that fails its pre-trend test.
The practical implication is to invest in a better comparison: matched facilities with similar pre-period patterns, a longer route-level design, or a synthetic control with a transparent pre-fit. Border crossings and transit outcomes should be treated as spillover checks, not silently folded into the control.
Decision and Next Step
P0: do not make a causal policy claim from this control group. P1: pre-register a new control-selection rule and require acceptable pre-trend fit before estimating post-policy effects. P2: add weather, construction, transit, and facility-disruption data as supporting evidence. A future result should report effect size, interval, placebo tests, and border substitution together.
Risks and Limitations
- The outcome is all-car bridge and tunnel traffic, not HVFHV demand.
- Ten facility clusters make cluster-based uncertainty fragile; the analysis uses HAC uncertainty on weekly group differences and states that limitation.
- Facility-specific shocks and spillovers may remain.
- The charge can apply to trips to, from, within, or through the zone; facility counts do not reveal every trip's toll exposure.
Interview explanation
30-second explanation: “I tested a difference-in-differences event study using official MTA facility traffic from 2019 to 2026. The key result was not a policy effect: treated crossings were already moving differently before 5 January 2025, so parallel trends failed. I would not recommend changing marketplace pricing from that model. I would redesign the control group, add disruption and transit data, and require acceptable pre-trend and placebo results before making a causal claim.”
2-minute explanation: Explain the treatment facilities, comparison facilities, weekly grain, event-time coefficients, pre-trend failure, placebo logic, spillovers, and why a non-identification result is more useful than a precise but biased effect.
5-minute deep dive: Walk through the source query, facility classification, panel balance, aggregation choice, model estimand, HAC uncertainty, alternative controls, treatment exposure limits, and the decision rule that blocks a rollout when identification fails.
Supporting detail
The source query, event-study code, and output manifest live under projects/growth-analytics/03-congestion-pricing-causal-impact. The original HVFHV route-level design remains private until route exposure and a defensible control are available.