Financial Metrics: Building a Reconciled Company Performance Mart
In brief
A filing-aware metric model that keeps reported periods, units, and restatements visible before financial trends reach a dashboard.
Business question
How can a team use public financial data without turning inconsistent filing facts into false precision?
Why it matters
Revenue growth can look healthy while profitability weakens. A metric mart should make that trade-off visible and preserve enough source context for a reviewer to understand how each number was chosen.
Decision brief
- Recommendation: use a narrow, reconciled annual metric layer for executive trend questions, and keep the raw fact history available for deeper review.
- Evidence: SEC Company Facts provides issuer facts with tags, units, filing dates, fiscal periods, and reported values. The evidence manifest records the source and selection rules.
- Business value: consistent metric definitions reduce disagreements over which filing value belongs in a trend chart.
- Main risk: public filings are not a company’s internal operating model. They do not provide product-level drivers, customer cohorts, or live performance.
- Next action: add source freshness and reconciliation checks before connecting the mart to a dashboard or planning model.
What the data represents
The source is the SEC Company Facts API. The case uses reported issuer facts rather than a market-price feed. The relevant grain is a reported fact and its context: tag, unit, fiscal period, frame, filing date, and value.
Analytics architecture
SEC JSON → normalized fact staging → period selection → finance metric mart → trend chart
The raw source keeps filing context. The normalized layer makes periods and units explicit. The final mart contains only metrics whose selection rule is documented. This prevents a dashboard query from silently choosing between quarterly, annual, and restated facts.
What I checked first
- Are revenue and net income using compatible units?
- Is each annual value tied to the right fiscal period?
- Are duplicate facts caused by multiple filings or tags?
- Are margins calculated from the selected numerator and denominator?
- Can a reviewer trace the chart value back to the source fact?
What the evidence shows
Revenue and net income need to be read together
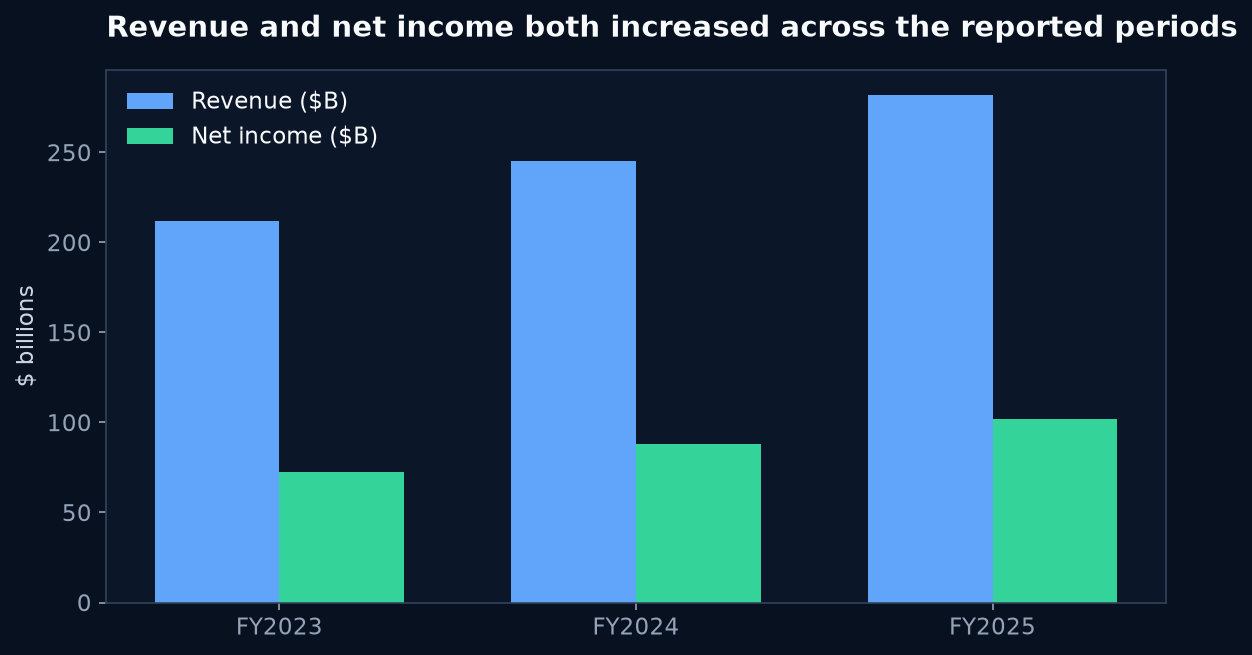 Chart takeaway: Reported revenue and net income over the selected fiscal periods
Revenue is a scale measure. Net income shows what remains after costs. Showing both prevents growth from being interpreted as improving business performance by default.
Margin turns the growth story into a performance question
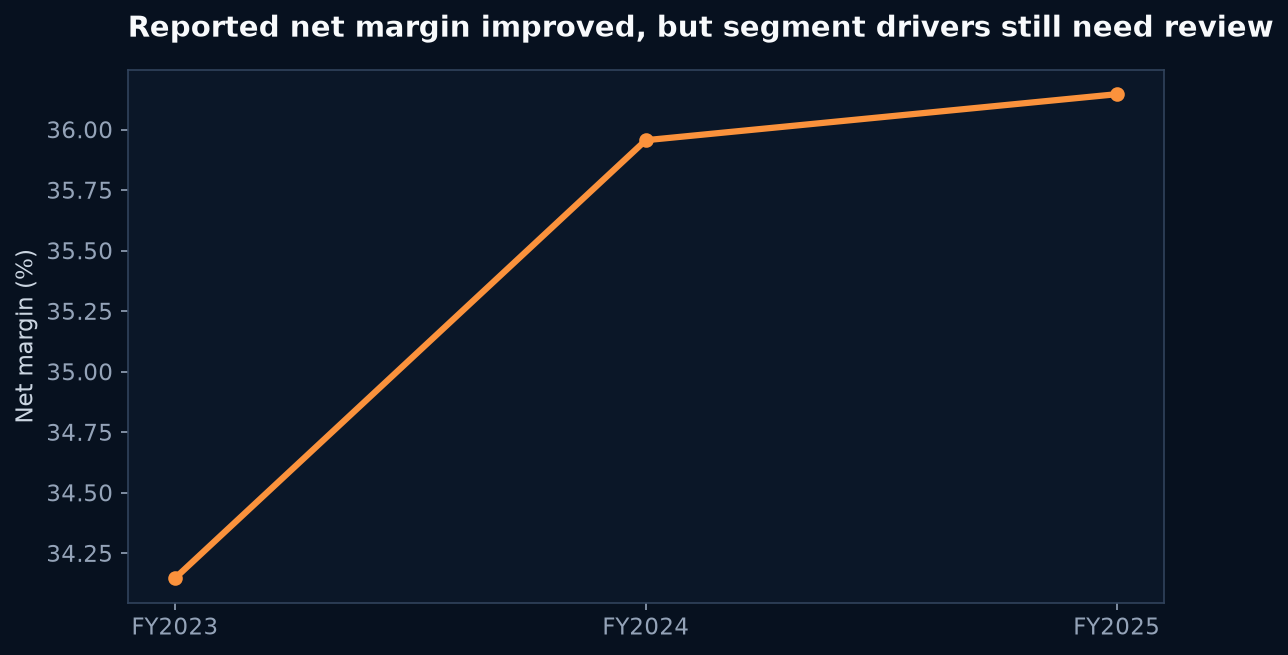 Chart takeaway: Reported net margin over the selected fiscal periods
Net margin is calculated as selected net income divided by selected revenue. It is a useful summary, but it does not explain which product, cost, or market drove the change.
A financial metric is only as trustworthy as its lineage
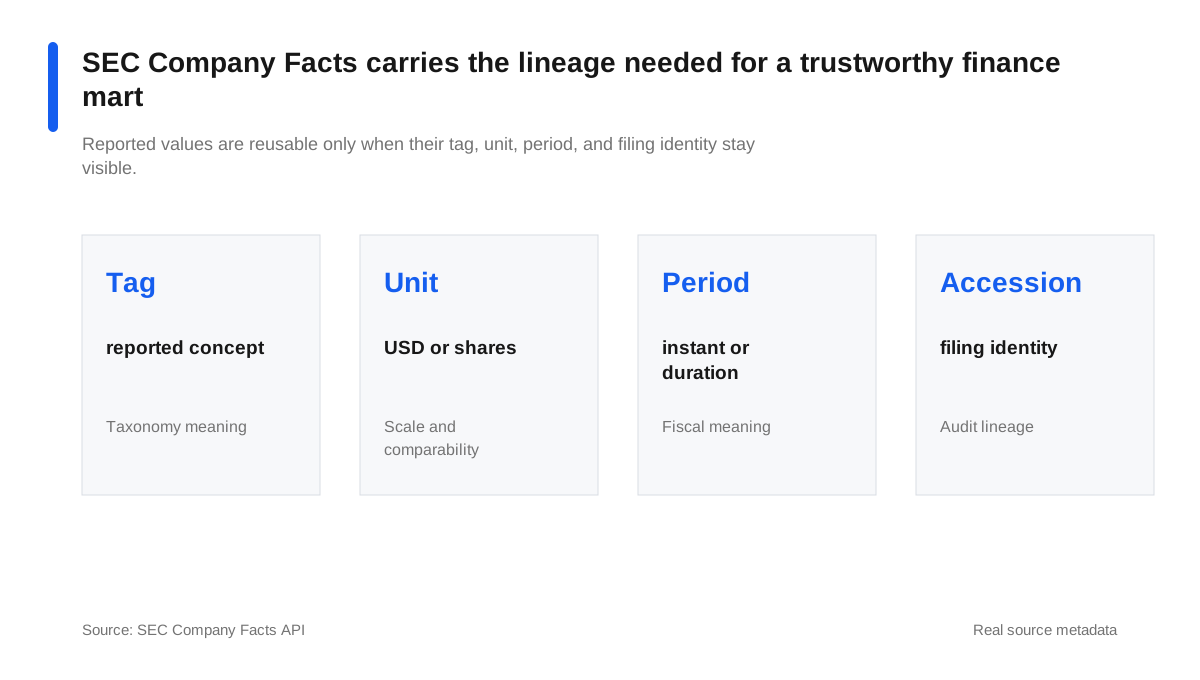 Chart takeaway: The fact grain and lineage needed for a filing-aware finance metric mart
The chart is built from a metric definition, not from a convenient spreadsheet cell. The source context remains available for audit and later expansion.
Recommendation
What: publish a small finance mart with explicit metric definitions, period rules, units, and source links.
Where / who: finance, analytics engineering, and business teams should agree on the annual reporting view before extending it to quarterly or product-level measures.
Why: reported financial facts can be valid individually and still become misleading when mixed across periods or units.
Risk: a reconciled metric layer can describe performance without explaining its operational drivers.
Next test: reconcile the selected annual metrics to the issuer’s filings, add freshness checks, and then join approved operating metrics only after the grain is documented.
Measurement plan
Monitor source freshness, fact-to-mart row counts, unit consistency, annual period coverage, and reconciliation variance. For a company’s internal data, add gross margin, customer retention, acquisition cost, and product-level contribution only when their definitions are approved.
Key takeaway
Financial analytics is not only about calculating a ratio. It is about preserving the reporting context so a decision-maker can trust what the ratio means.
Read technical details
Technical appendix
The evidence manifest records the SEC source, expected metric fields, period boundary, and validation notes. The public site intentionally exposes the model decision and charts, not raw filing payloads or private business data.