Commercial Electricity: Where Should a Multi-Site Business Review Cost Risk?
In brief
A state-level price review finds where commercial electricity costs rose fastest, while setting clear limits on what public averages can say about a company's bills.
Executive summary
Decision: where should a multi-site business start reviewing electricity costs? Finding: the EIA's sales-weighted average commercial retail price rose from 10.68 cents per kilowatt-hour in 2019 to 13.41 cents in 2025, a 25.6% nominal increase. State prices and changes differed widely. Recommendation: use state averages to set review priorities, then check actual site bills, utility tariffs, and load patterns before choosing an action. The public data does not measure a company's costs or savings.
Problem - one national assumption can hide local cost exposure
A finance team may set one electricity cost assumption for every location. That can miss markets where prices are already high or where the published average has risen quickly. The business question is: which locations should a multi-site operator review first, and what can public data support before a site-level audit?
The analysis is a market screen. It does not estimate a particular company's energy bill, operating margin, or savings opportunity.
Hypotheses - what could explain cost pressure?
- The national commercial average price may be rising. Compare a consistent annual price across the same period.
- High-cost states may also have faster increases. Compare 2025 state prices with their 2019 to 2025 changes.
- State prices may be enough to select investments. Check whether the public figures include the tariffs and load details required for a company decision.
Analysis - what do EIA data show?
The source is the U.S. Energy Information Administration's monthly Form EIA-861M electricity sales and revenue data. The checked snapshot covers January 2019 through December 2025. Each row is a state, month, and sector. I kept the commercial sector, analyzed the 50 states and District of Columbia separately, and used the EIA U.S. aggregate for the national trend. Regional aggregates were excluded from the state comparisons. EIA makes state-level adjustments for non-sampled entities; the monthly figures cover bundled service.
For each year, I calculated the sales-weighted price as 100 times total commercial revenue divided by total commercial sales. The published units convert to cents per kilowatt-hour. Prices are nominal and are not adjusted for general inflation.
The national commercial average price rose, but it is not a company bill
The U.S. aggregate increased by 25.6% between 2019 and 2025. The average retail price dipped slightly in 2020, then rose each year from 2021 through 2025.
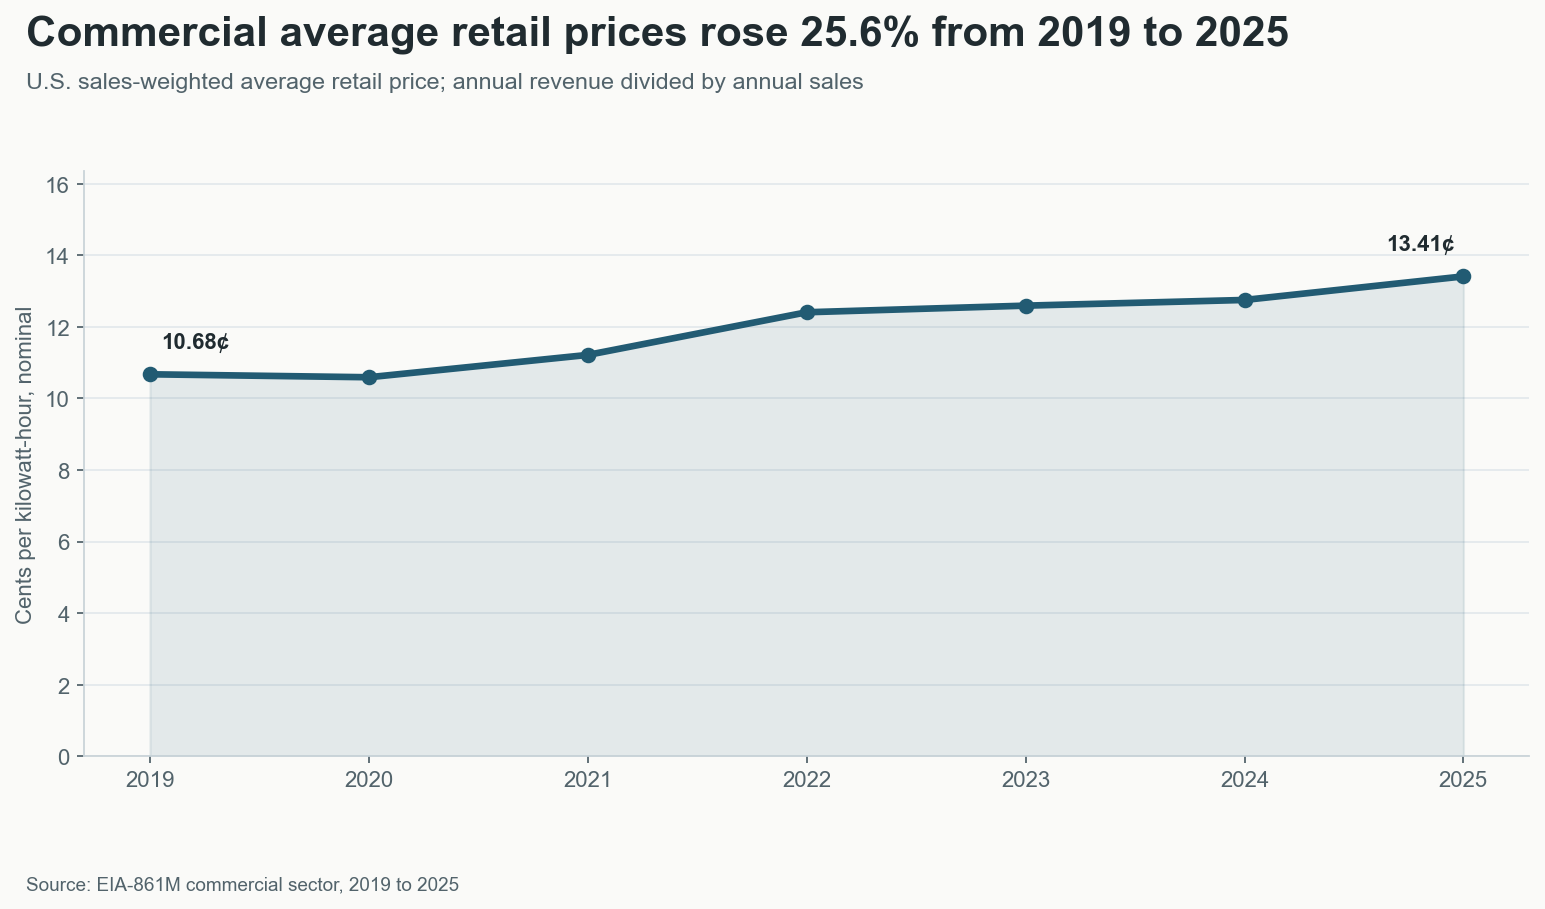 Scroll horizontally to inspect chart labels.Chart takeaway: U.S. commercial electricity price rose from 10.68 cents per kilowatt-hour in 2019 to 13.41 cents in 2025
This supports updating the national planning baseline. It does not show how a specific business's bill changed because the EIA value is an average across commercial customers and utility arrangements.
Price levels and growth differ across states
Hawaii had the highest 2025 state average at 36.4 cents per kilowatt-hour, followed by California at 26.4 cents. Across states, the median nominal price increase was 21.7%. The District of Columbia, Maine, and California had increases of 66.5%, 63.4%, and 58.1%, respectively. The chart highlights markets above the 75th percentile on both price and growth; dashed lines show state medians.
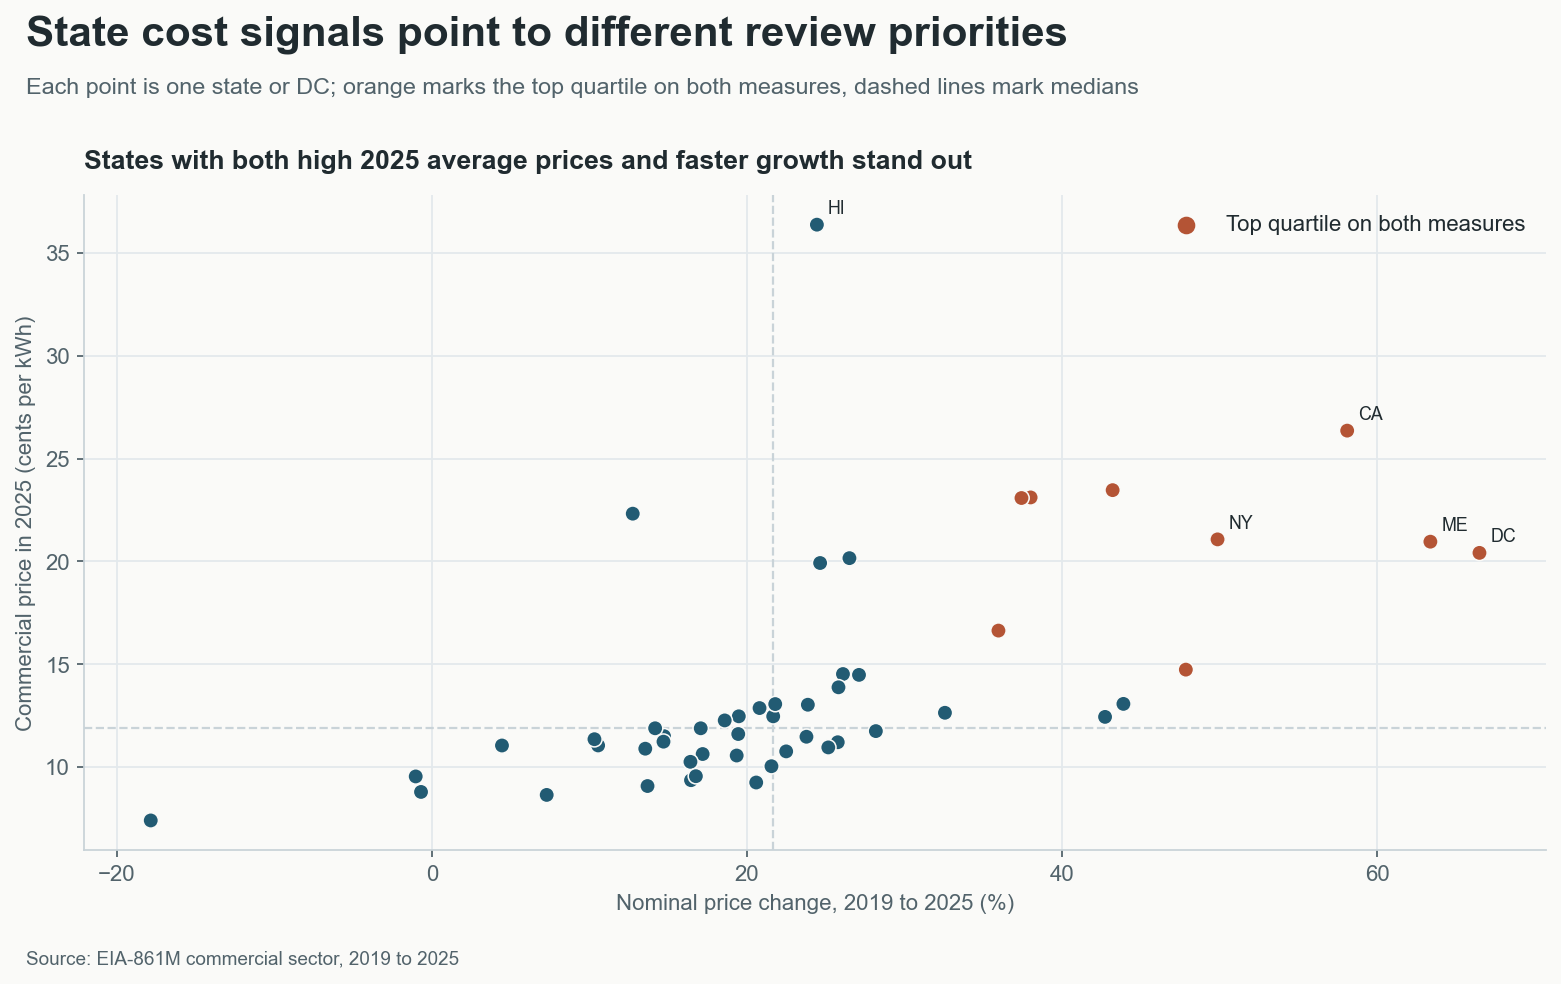 Scroll horizontally to inspect chart labels.Chart takeaway: State comparison of 2025 commercial electricity price and nominal price growth from 2019 to 2025, with states in the top quartile for both measures highlighted
This comparison helps identify markets for a closer review. It does not show that an operator in a highlighted state can negotiate a lower price or save a particular amount.
The highest-price markets do not share one cost pattern
Hawaii and California led the 2025 state averages, but their changes since 2019 were different. The comparison keeps the earlier level visible so a team does not confuse a high current price with the fastest increase.
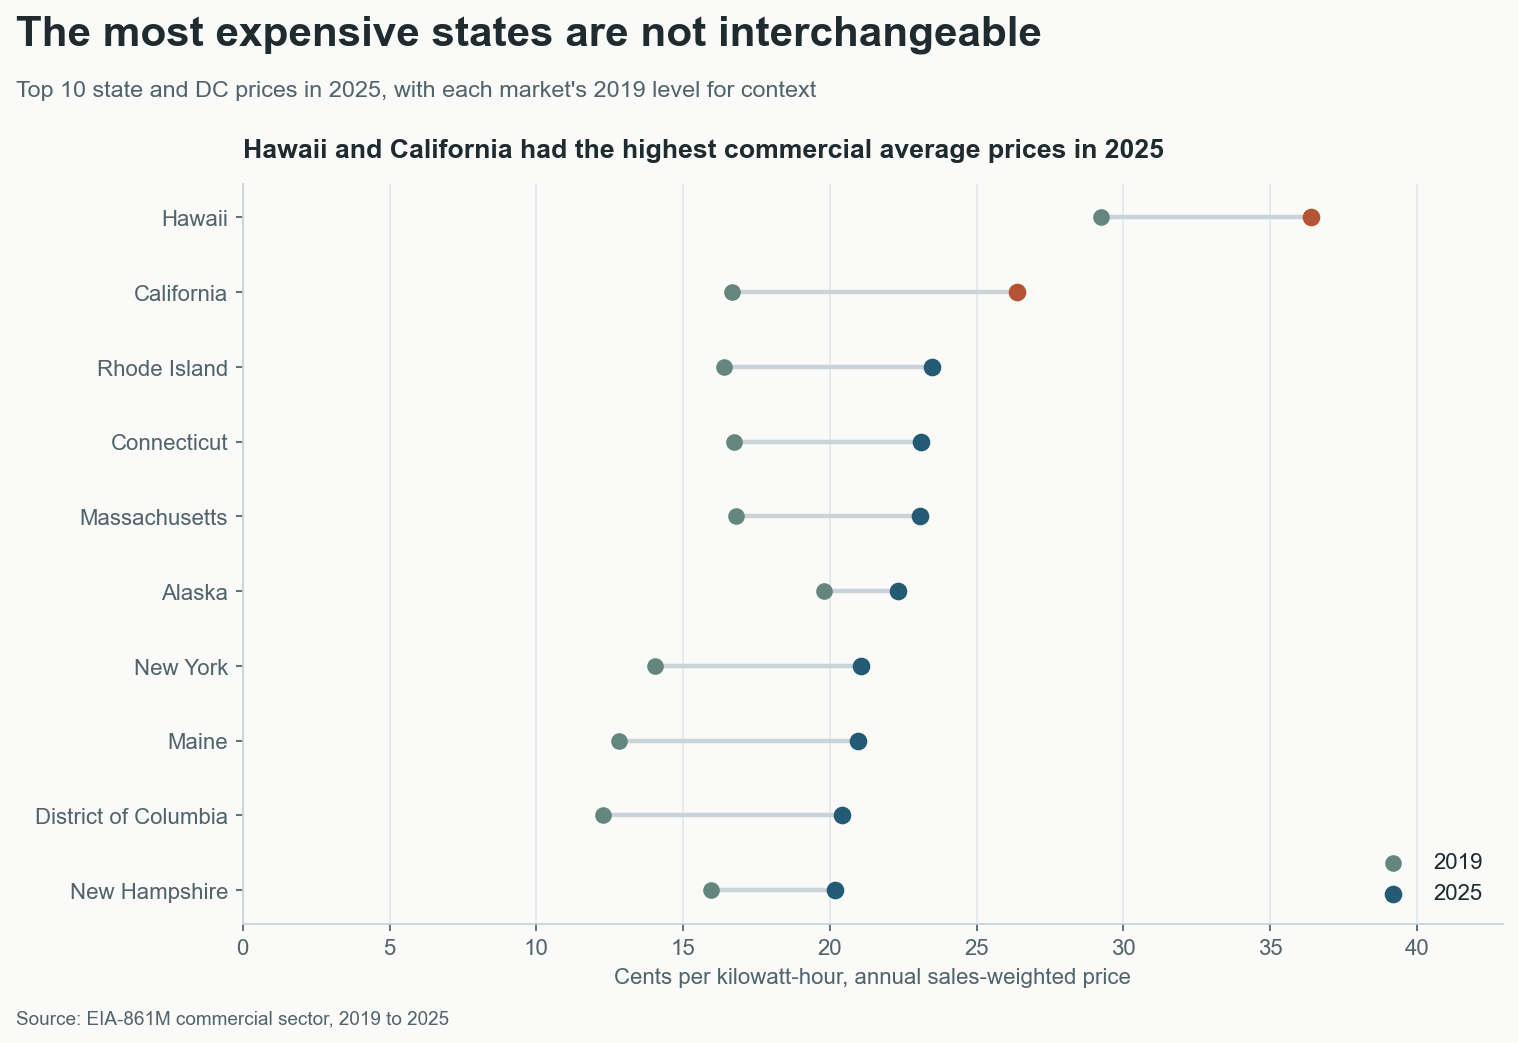 Scroll horizontally to inspect chart labels.Chart takeaway: Ten highest state and District of Columbia commercial electricity prices in 2025, compared with their 2019 prices
The distinction matters for planning: a high level may call for a tariff and load review, while a fast increase may call for a budget and contract review. Neither signal replaces actual bills.
Result - use the state screen to prioritize site reviews
The evidence supports the first two hypotheses: the national commercial average retail price rose, and both 2025 price levels and 2019 to 2025 changes vary by state. The third hypothesis is not supported. A state average is not detailed enough to choose a procurement or efficiency investment.
- Start a bill and tariff review in sites with high prices, steep increases, or both.
- Compare each location's time-of-use rate, demand charges, contract terms, load profile, and operating schedule.
- Evaluate efficiency work using site-specific baseline consumption and costs, adjusted for weather, occupancy, and production.
- Track realized cost per kilowatt-hour and peak demand after a pilot. The EIA analysis does not measure savings.
Technical notes
The analysis uses 5,208 monthly EIA records, including state, District of Columbia, U.S. aggregate, and regional rows. The state comparison contains 51 complete series with 84 months each. Annual weighted prices use EIA revenue and sales totals; the analysis does not use a simple average of monthly prices. Data, source hashes, and the regeneration command are documented in docs/new-public-data-case-notes.md.
The source is EIA Form EIA-861M. EIA derives its average retail price from utility revenue and sales. Utility revenue can include energy, demand, delivery, tax, and other charges, but the average is not a utility tariff and does not separate those components for a specific site. EIA does not publish utility tariffs or itemized demand charges. See EIA's price definition and rate and tariff data boundary. The analysis does not establish the effect of any policy or energy-efficiency change.