Fresh Produce Sourcing: Where Should Buyers Build Origin Alternatives?
In brief
A top-origin concentration screen compares fresh fruit and vegetable imports across matched eight-month periods, with explicit bounds for unreported suppliers.
Business question
Which fresh-produce categories should a grocery or food-service buyer review first for alternative origin coverage?
Why it matters
An import category can have several countries in its top ten and still depend heavily on one origin. A sourcing team needs a way to separate concentrated categories from diversified ones before spending time on supplier qualification, logistics checks, and product substitutions.
Decision brief
- Recommendation: start an item-level alternate-origin review for fresh vegetables. The category had a higher origin concentration bound than fresh fruit during January through August 2026.
- Evidence: Mexico was the top reported origin in each monthly observation for both categories. Its average share was 55.3% for fresh vegetables and 45.9% for fresh fruit.
- Evidence strength: High for concentration across reported country-origin import values; low for a specific buyer's supplier exposure or disruption probability.
- Main risk: USDA reports aggregated categories and the ten largest origins. Country of origin does not identify vendors, contracts, logistics alternatives, or substitutable products.
- Next test: map affected SKUs and supplier contracts to alternate origins, then assess capacity, lead time, seasonal availability, product specification, and landed cost.
Data used
The source is USDA Economic Research Service's Foreign Agricultural Trade of the United States. I used its monthly table of the top ten import sources for fresh or frozen fruit and vegetables by customs value. The source page was updated October 8, 2026. The comparison covers January through August in 2025 and 2026.
Each selected category-month includes ten reported origins and a World total. The source records customs value in millions of U.S. dollars. It does not report each buyer's suppliers, physical quantities for this table, or individual products within the aggregated categories.
Analysis
Fresh vegetable origins are more concentrated
The average monthly Herfindahl-Hirschman Index (HHI) for fresh vegetables was 0.4188 to 0.4192 in January through August 2026. The corresponding fresh-fruit bound was 0.2638 to 0.2670. These are indices on a zero-to-one scale, calculated from monthly origin shares.
The ten reported origins covered an average of 97.9% of fresh-vegetable import value. Coverage for fresh fruit was 94.6%. The narrow bounds show that the residual value has little effect on the vegetable concentration estimate. The fruit range is wider, but still small relative to the gap between categories.
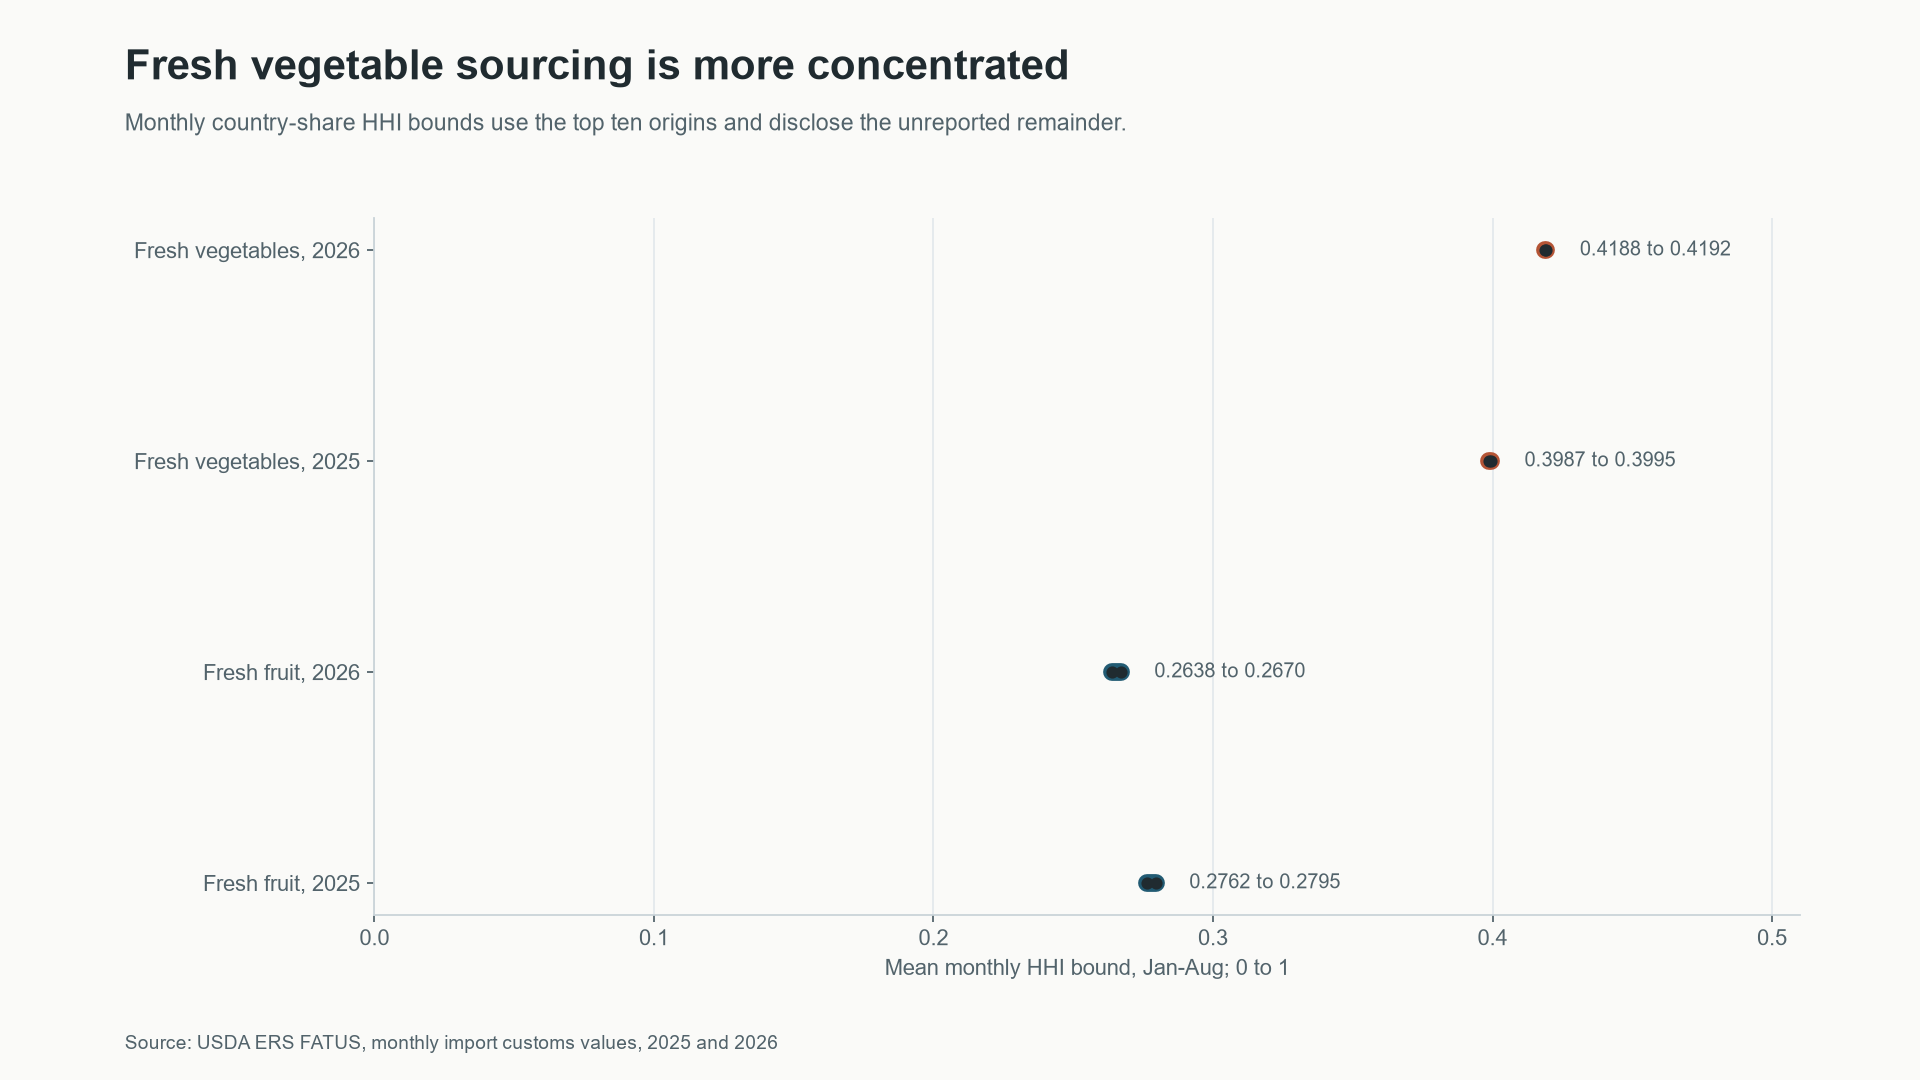 Scroll horizontally to inspect chart labels.Chart takeaway: Monthly import-origin HHI bounds for fresh fruit and vegetables, January to August 2025 and 2026
Mexico led both categories, with seasonal changes
Mexico remained the leading reported origin in all eight monthly observations for both categories. Its average share was 55.3% for fresh vegetables, ranging from 42.7% to 65.4%. For fresh fruit, the average was 45.9%, ranging from 31.3% to 61.8%.
The shares change across months. A procurement review should therefore map product seasonality and growing regions, rather than rely on one annual average.
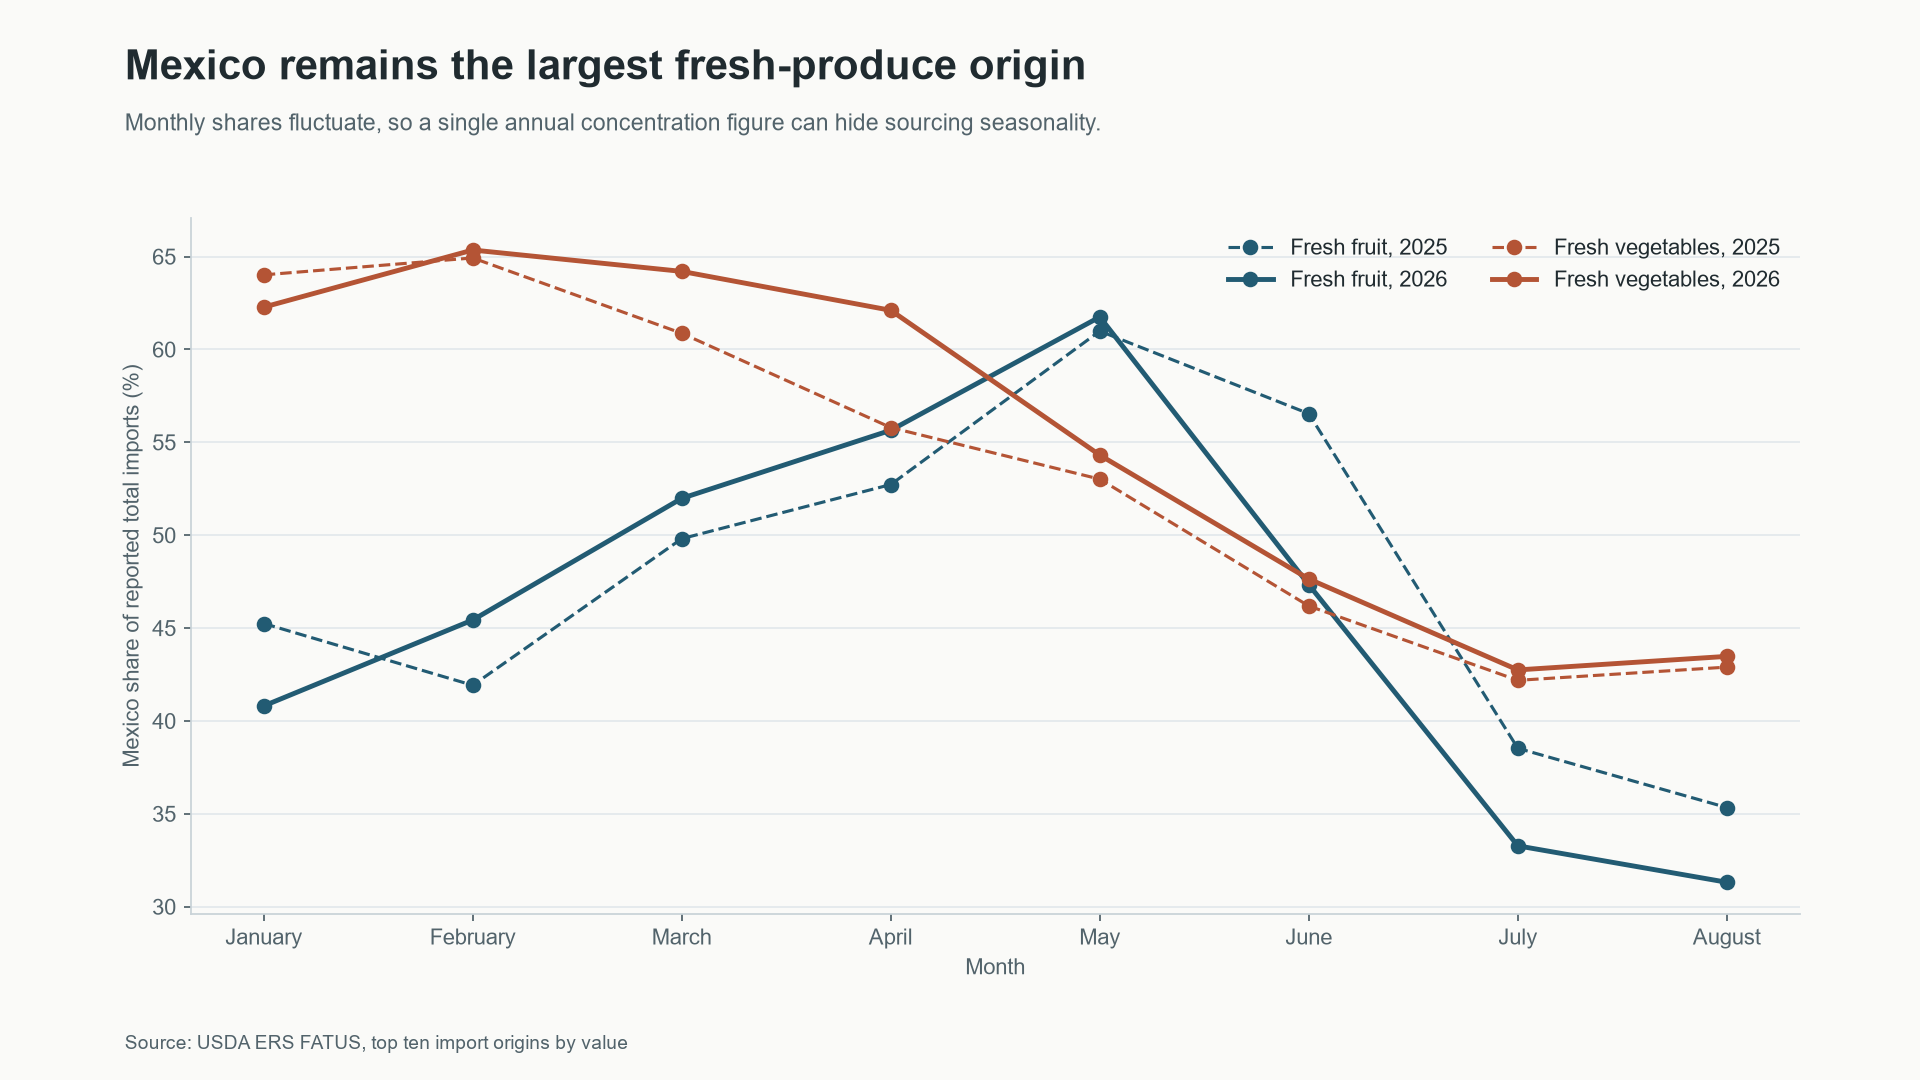 Scroll horizontally to inspect chart labels.Chart takeaway: Mexico's share of fresh fruit and vegetable import value by month in 2025 and 2026
Import values changed differently year over year
January through August customs value for fresh vegetables totaled $10.61 billion, up 2.6% from the same months in 2025. Fresh-fruit value totaled $13.82 billion, down 7.7%. These are nominal dollar values, not physical volumes or unit prices. Changes can reflect price and product mix as well as quantity.
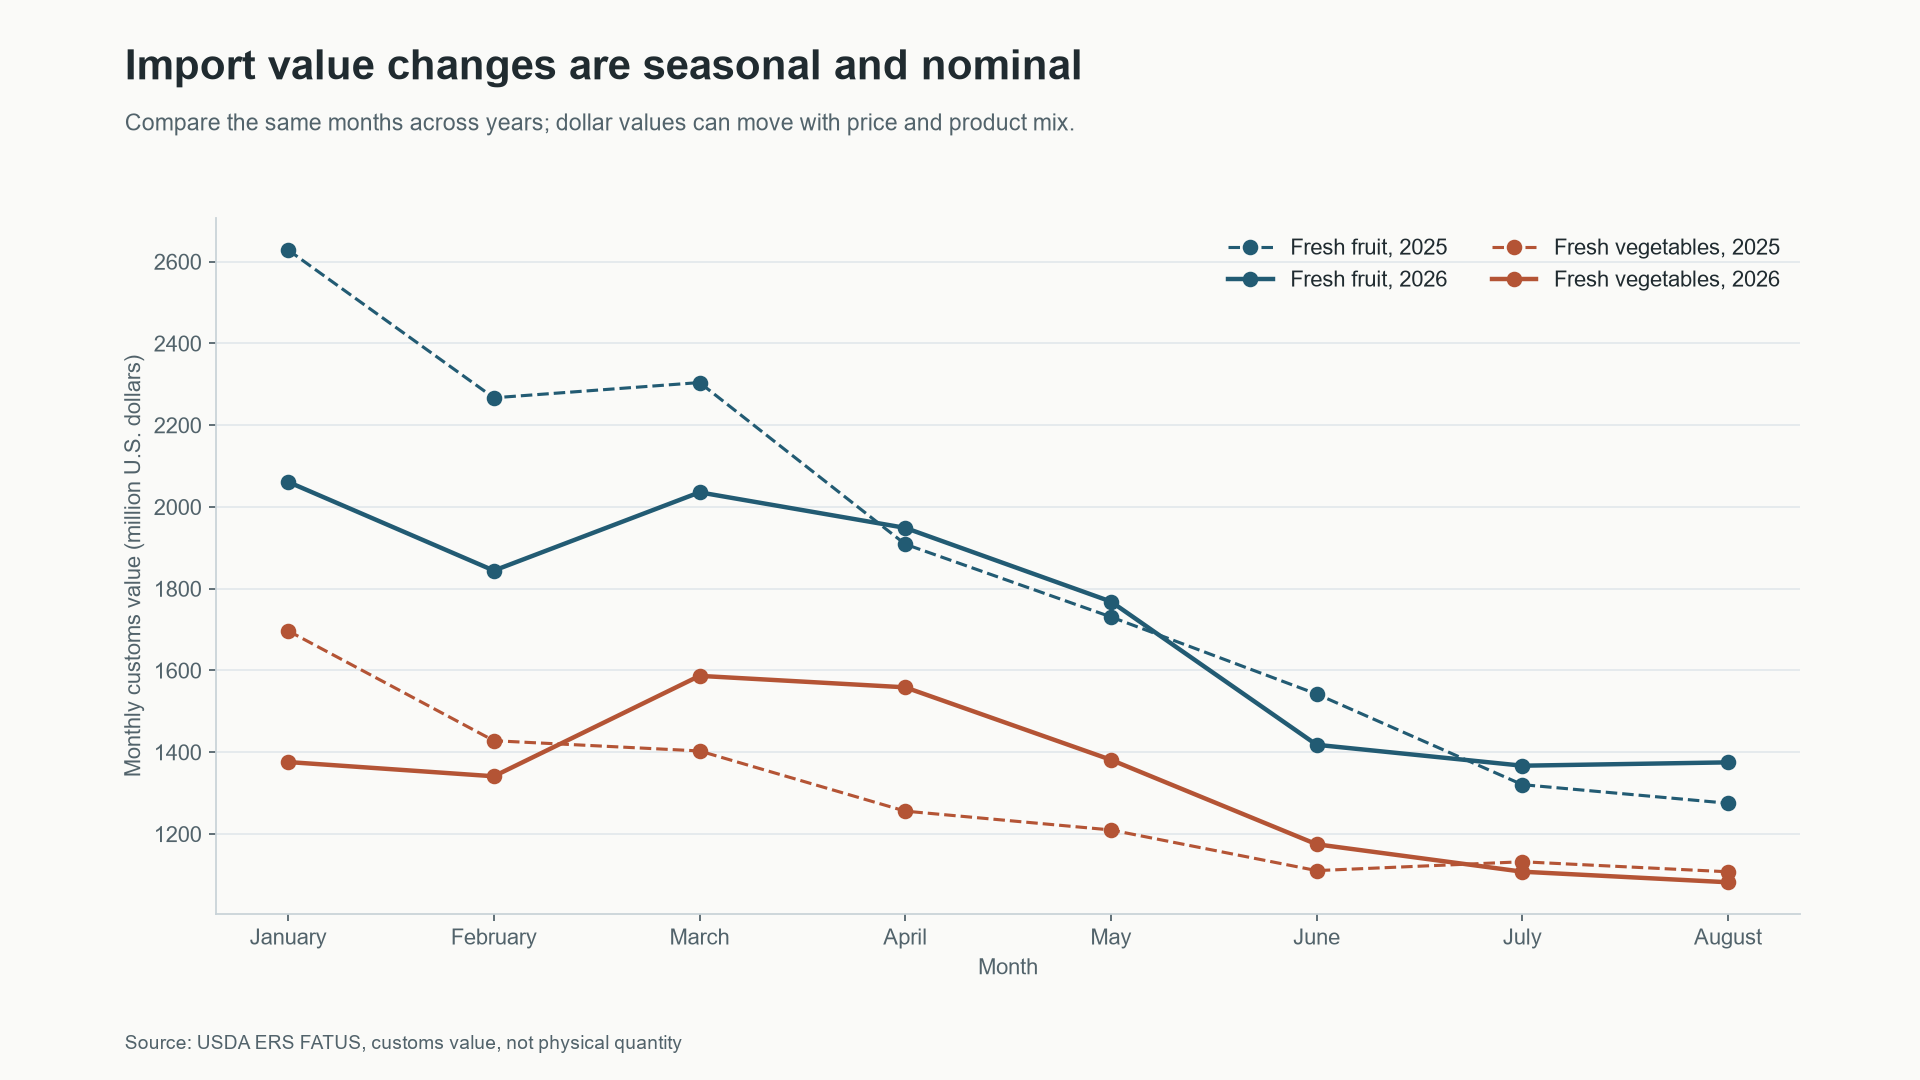 Scroll horizontally to inspect chart labels.Chart takeaway: Monthly customs values for fresh fruit and vegetables, January to August in 2025 and 2026
Result - test alternate origins for fresh vegetables first
The concentration screen places fresh vegetables first for deeper origin-diversification work. Fresh fruit also relies heavily on Mexico, although its ten-origin mix is more distributed in the current data. Neither finding proves that the market would be disrupted or that another source can replace current imports.
The next step is to join a buyer's own SKU and supplier data to origin, seasonality, landed cost, and contract capacity. A scenario should model a temporary constraint on one origin and test product substitution, lead-time, and service-level tradeoffs.
Technical notes
The analysis uses the FATUS top-ten source table. For each category and month, I divided each origin's customs value by the corresponding World total. The lower HHI bound is the sum of squared shares for the ten listed origins. The upper bound assigns the unreported residual share to one additional origin. These bounds do not assume that the residual is a known supplier.
The source is USDA ERS FATUS. Data, source hash, and regeneration command are recorded in the evidence manifest. The source is mutable; the manifest records the snapshot used for these results.