Campaign Incrementality: Did Advertising Create New Customers?
In brief
A randomized advertising analysis that separates additional conversions from customers who would have converted anyway.
Problem - Did the advertising create additional conversions?
A campaign can receive credit for conversions from people who would have acted anyway. The growth team needs to know whether assigning users to advertising changed conversion, then whether any added conversions were worth their cost.
Hypotheses - What could explain the campaign result?
- Advertising may increase conversion over a holdout. Compare all users by randomized assignment, regardless of whether an ad was actually shown.
- Response may differ across audiences. Explore the anonymized features, but treat any segment pattern as a hypothesis to retest.
- A measurable lift may still be unprofitable. Compare incremental acquisition cost with contribution before scaling.
Analysis - What did the randomized benchmark show?
The source is the Criteo AI Lab uplift dataset, a released benchmark combining randomized advertising tests. It contains 13,979,592 user records. Its anonymized features cannot be translated into business-defined customer groups, and Criteo warns that the combined, sampled release does not recover an original campaign effect.
Assigned advertising increased conversion in this benchmark
The control group converted at 0.194%, compared with 0.309% in the assigned-advertising group. The absolute difference was 0.115 percentage points (95% confidence interval: 0.108–0.122 points).
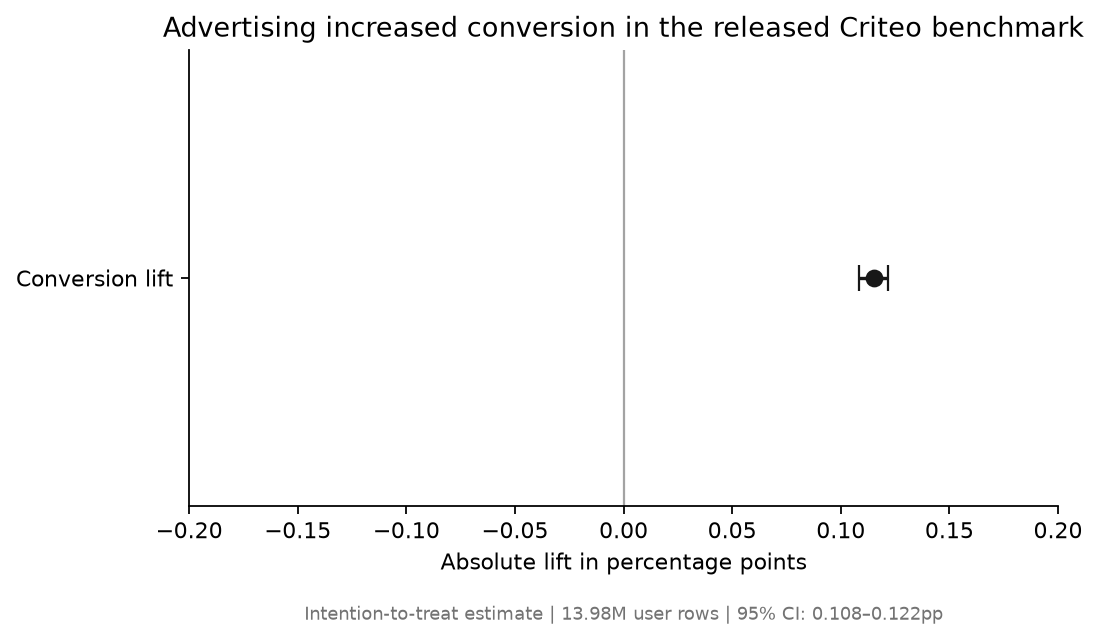 Scroll horizontally to inspect chart labels.Chart takeaway: Criteo randomized benchmark: assignment to advertising increased conversion by 0.115 percentage points; the 95% confidence interval is shown
The comparison uses assignment, so users remain in their randomized group even if they were not exposed to an ad. This supports an intention-to-treat estimate for this benchmark, not a forecast for a current campaign.
The benchmark lift has no cost or value attached
The measured difference is about 115 additional conversions per 100,000 assigned users in the released sample. The dataset does not contain ad cost, margin, conversion value, or later customer value, so this result cannot establish profitability.
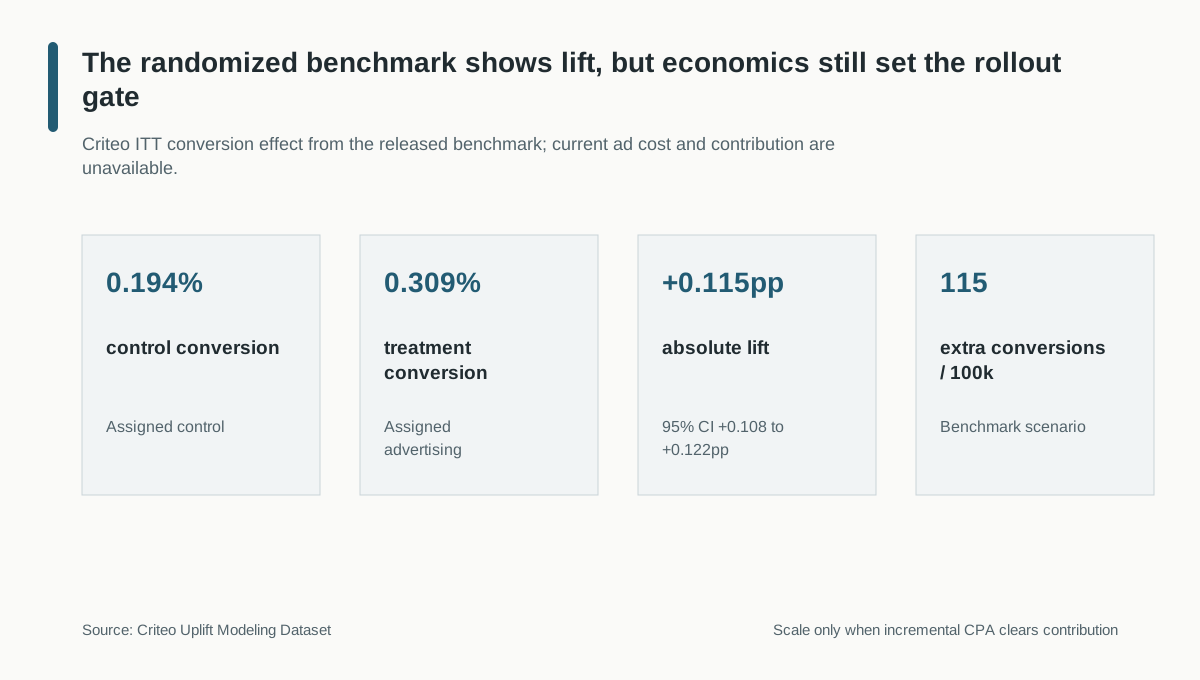 Scroll horizontally to inspect chart labels.Chart takeaway: Criteo benchmark economics: control conversion was 0.194%, treatment was 0.309%, and the 0.115-point lift equals about 115 additional conversions per 100,000 assigned users
The chart states the scale of the observed difference. A current campaign still needs its own holdout and contribution data before the business can decide whether to spend more.
One anonymized feature band is an exploratory lead
A post-hoc check divided feature f0 into four equal-sized bands. The observed absolute lifts were 0.038, 0.386, 0.019, and 0.010 percentage points. The feature has no business label, and searching multiple segments can surface chance patterns.
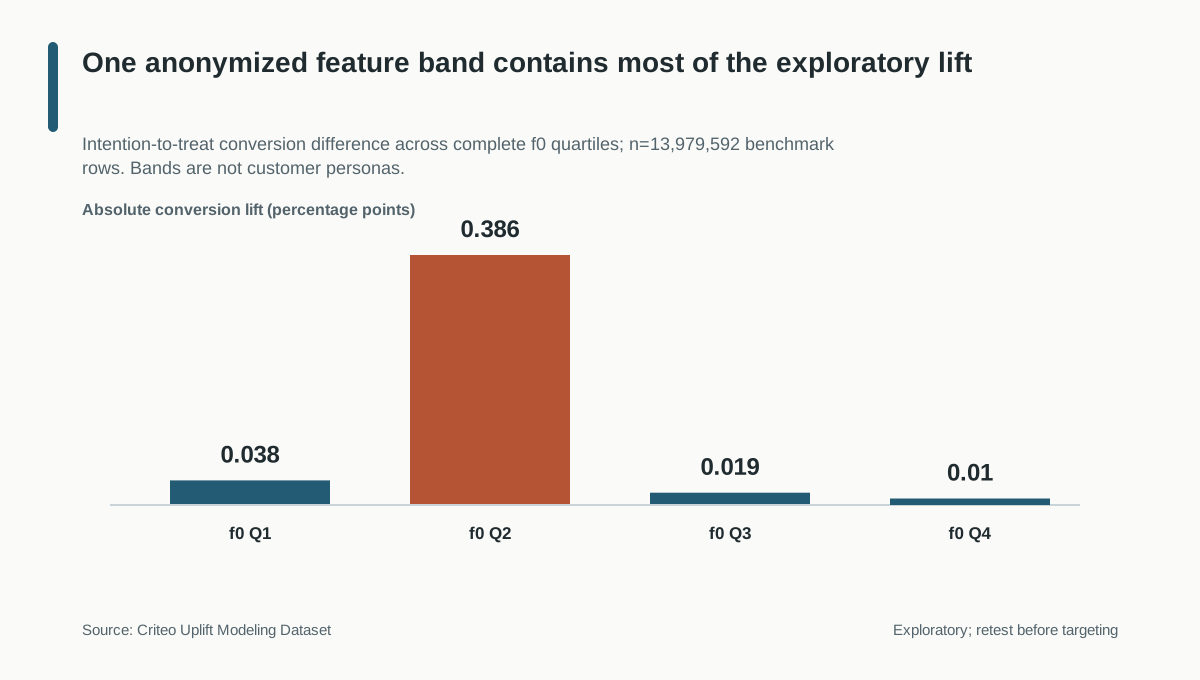 Scroll horizontally to inspect chart labels.Chart takeaway: Exploratory Criteo f0 quartiles: observed lifts were 0.038, 0.386, 0.019, and 0.010 percentage points; the largest band is a retest hypothesis, not a targeting rule
Treat the largest difference as a hypothesis only. A fresh, pre-registered holdout is needed before targeting from it.
Result - Keep the holdout and make profitability the scale gate
The released benchmark supports a positive assignment-level conversion difference. It does not establish the current campaign’s lift, economics, or a segment-level targeting policy.
Recommendation: run a randomized holdout in the current campaign, with a pre-registered primary conversion measure, minimum useful effect, sample size, stopping rule, and guardrails. Scale only if measured incremental CPA is below contribution value and the result remains stable under the agreed audience and frequency rules.
Limitations: treatment assignment is the causal comparison; exposure is downstream. The benchmark combines and samples experiments, features are anonymized, and current campaign cost, margin, and retention are unavailable. No live campaign or commercial result is included in this analysis.
Read technical details
Technical appendix
The analysis uses intention-to-treat: each user remains in the group they were assigned to. The source checks include row count, schema, binary outcomes, control exposure, and sample ratio. Analysis code, SQL, and validation document the calculation and source boundary.