Marketplace Supply and Demand: What Can the Public Data Tell Us?
In brief
A limited-data marketplace diagnosis that separates recorded trips from the requests and driver hours needed to measure imbalance.
Problem - Where is the marketplace under pressure?
Leadership hears that riders wait longer and rides are lost in some areas, and wants to know whether driver incentives should increase. Recorded trips alone cannot tell whether a quiet period had low demand or weak supply, or whether a busy period still left riders unserved.
The decision is where and when to investigate before committing to a citywide incentive.
Hypotheses - What could explain the activity pattern?
- Demand may be concentrated by hour. Compare recorded trips across hours to find investigation windows.
- Recorded activity may rise without similar growth in driver coverage. Compare official monthly trip and driver measures.
- A peak may still be fully served. Check requests, matches, cancellations, wait, and online driver-hours before calling it a shortage; those measures are not in the public trip file.
Analysis - What do official TLC records show?
The analysis combines two different official sources: a one-week trip table for 1–7 February 2019 and monthly High Volume FHV reports for 2024 and 2025. They are separate descriptive views, not one continuous time series. The trip table records submitted dispatched trips; it does not show every request, rejected match, cancellation, wait, or online driver-hour.
Recorded trips peaked at 18:00 in the observed week
The bounded week contains 4,965,012 recorded trip rows. Counts ranged from 59,285 at 04:00 to 334,713 at 18:00.
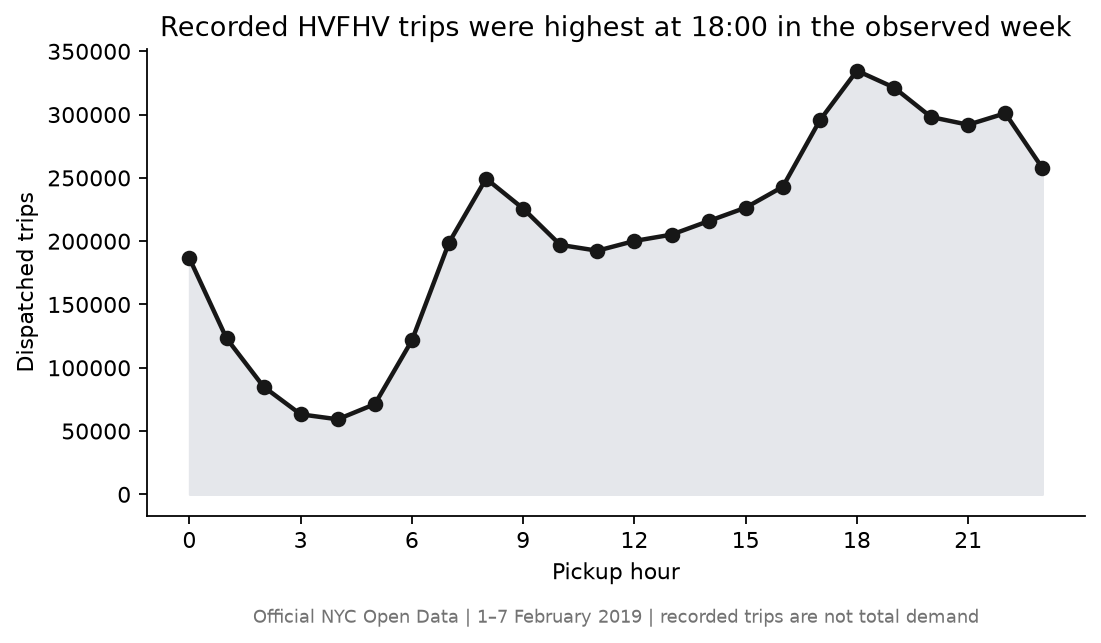 Scroll horizontally to inspect chart labels.Chart takeaway: Official NYC TLC HVFHV data, 1–7 February 2019: recorded trips peaked at 334,713 at 18:00; trip records do not show unserved requests
This makes early evening a reasonable time to inspect with internal request and wait data. It is not evidence that 18:00 had unmet demand.
Trips rose 2% while driver totals stayed nearly flat
In the monthly reports, average trips per day rose from 654,410 in 2024 to 667,537 in 2025 (+2.0%). Average unique drivers changed from 83,399 to 83,299, while reported average hours per driver changed from 6.35 to 6.38 per day.
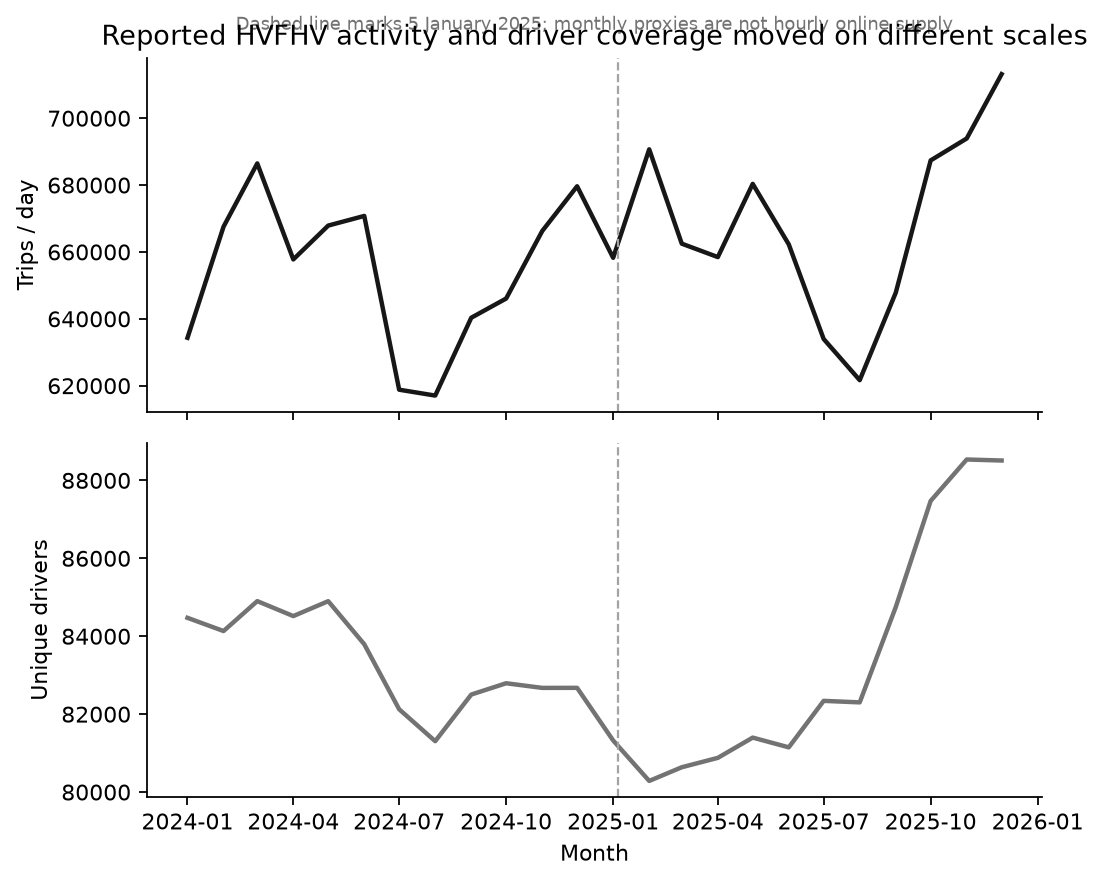 Scroll horizontally to inspect chart labels.Chart takeaway: TLC monthly High Volume FHV reports: average trips per day rose 2.0%, while unique-driver counts were nearly flat; reported driver hours rose 0.4%
The two measures do not move by the same amount, but monthly driver counts are not hourly online supply. The 2019 trip peak and the 2024–2025 averages also describe different periods and should not be combined into a single trend.
The public sources leave key parts of the funnel unknown
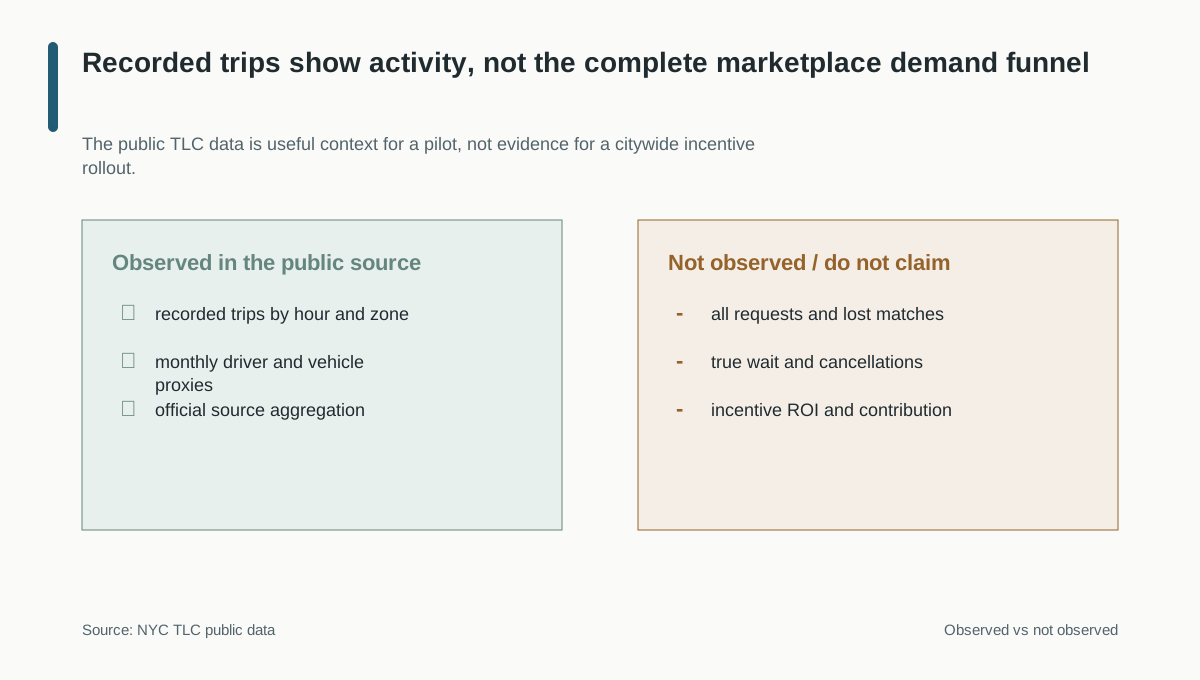 Scroll horizontally to inspect chart labels.Chart takeaway: NYC TLC marketplace evidence boundary: recorded trips and monthly driver proxies are observed; requests, lost matches, cancellations, true wait, and incentive return are not
Without these missing measures, the data cannot distinguish low demand, low availability, and poor matching.
Result - Instrument the request funnel before paying for more supply
The public data supports a time-of-day activity pattern and separate monthly supply proxies. It does not confirm a shortage or estimate incentive ROI.
Recommendation: do not raise incentives across the city based on trip counts. Add request, match, cancellation, wait, driver-online, incentive, and contribution records at the same zone-time grain. If those records show a repeated local shortage, run a powered zone-time or switchback test. Measure request fulfillment as the customer outcome, trips per online driver-hour as a supply diagnostic, and incremental fulfilled trips per incentive dollar as the economic measure. Monitor wait, cancellations, driver earnings, and neighboring-zone displacement.
Limitations: the trip slice is from 2019 while the monthly comparison covers 2024–2025. Neither public source shows every request, lost match, or zone-hour online driver. No incentive pilot or marketplace outcome is measured here.
Read technical details
Technical appendix
The hourly aggregation is checked for 24 hour buckets and a total of 4,965,012 rows. The monthly report is summarized separately by year. The source and chart generation notes are in the marketplace analysis files.